ai infographic generator
An AI infographic generator you fix by drawing a box
Generate infographics, roadmaps, posters and cover art from a description, a template or a reference image — or from a research run, so the content holds up. To change something, box the area, say what it should become, and Divrite redraws only that part. Every version is kept.
- Text or reference images
- Edit several areas at once
- Full version history
annotations
- 1Make the centre label larger and bold
- 2Turn this segment into a bar chart
only the boxed areas change
versions
- v1
- v2
- v3
every version is kept · branch from any of them
research first An image can be built on research too: Divrite researches the topic first and draws from the findings. How deep research works →
[01] real outputs
Visuals made with Divrite
The roadmap below came from a one-line request using a template. The pages next to it show how images sit inside larger pieces: charts for data, photos from the source pages, AI art for covers and concepts.
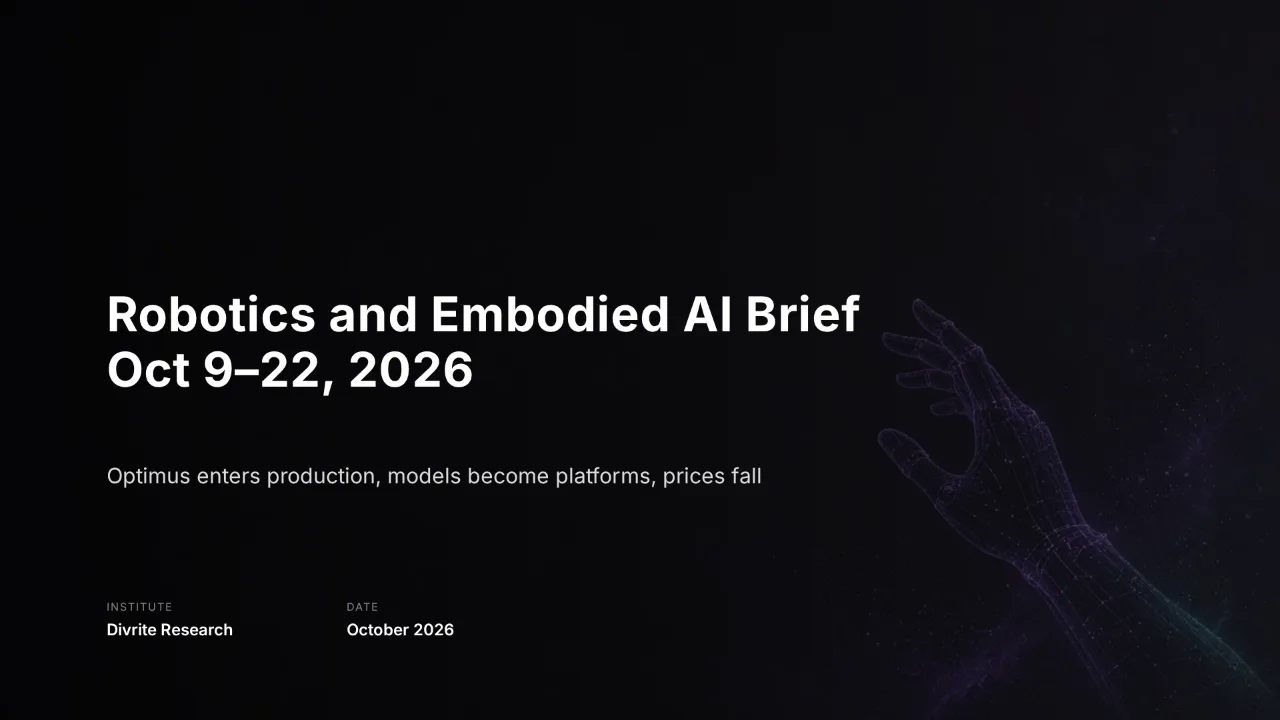 Web page
92 sources · English Also as presentation and report
Robotics and Embodied AI Brief · Oct 9–22, 2026
● Generated with Divrite
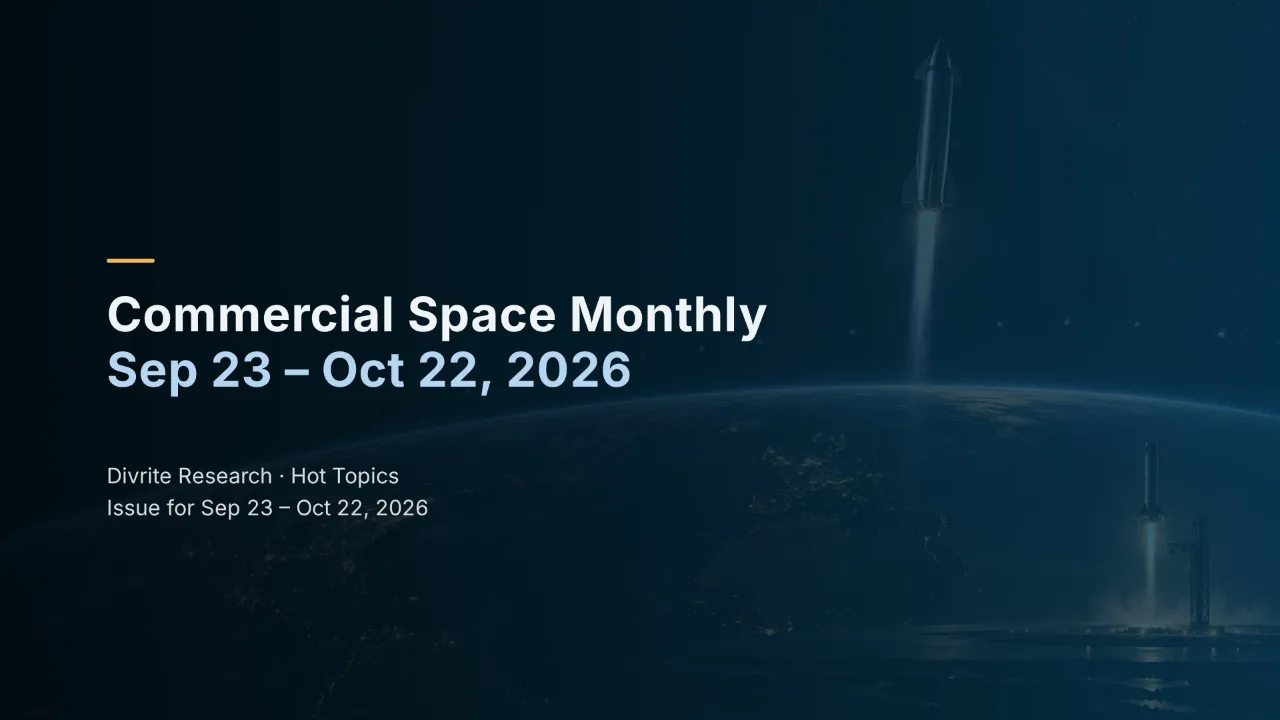 Web page
167 sources · English Also as presentation and report
Commercial Space Monthly · Sep 23 – Oct 22, 2026
● Generated with Divrite
 Web page
76 sources · English Also as presentation and report
Multimodal and Video Generation Brief · Oct 9–22, 2026
● Generated with Divrite
Every example here is a real Hot topics issue generated with Divrite.
See all Hot topics →[02] how it works
Generate, then edit only what’s wrong
-
step 01
Describe
Describe the image, start from a template, or add reference images to guide style and content. Pick portrait, landscape or square.
-
step 02
Generate
Divrite works out what the image needs to say, plans the composition and where the text goes, then draws it.
-
step 03
Box what to change
Drag boxes over the parts you want changed — as many as you need — and write what each should become. Everything outside the boxes stays the same.
-
step 04
Keep every version
Each edit is a new version; earlier ones stay. Continue from any version, or describe a change to the whole image instead.
[03] vs. a chat assistant
Edits that don’t start from scratch
Content
Chat ·Drawn from the prompt alone.
Divrite ·Can be drawn from a research run, so the figures and labels come from real sources.
Edits
Chat ·Re-prompt and get a whole new image.
Divrite ·Box specific areas; only those are redrawn.
Several fixes
Chat ·One change per message.
Divrite ·Annotate several areas in one pass, each with its own instruction.
History
Chat ·Earlier results scroll away in the thread.
Divrite ·A version history you can branch from.
[$] pricing
From $9.9/mo
Every plan includes deep research and all output formats — presentations, reports, web pages and images. You pay with monthly credits, and each task shows its credit estimate before it runs. Final prices are shown at checkout.
[04] faq
Frequently asked questions
What kinds of images work best?
How does editing by annotation work?
Can I use reference images?
Are earlier versions kept?
Can Divrite research the topic before drawing?
How are images chosen inside decks and reports?
[05] related
More of what Divrite does
- Deep research Splits your question by country, searches official sources in each local language, and keeps going until every point is settled. Learn more →
- AI presentations Researched decks in three densities, every key figure checked — native PPTX with editable text. Learn more →
- Research reports Long-form reports with chapters, verified charts and numbered references, in Word or PDF. Learn more →
- Interactive web pages Researched pages with section navigation and interactive charts, shared by link or as one HTML file. Learn more →
- Topic subscriptions Scheduled briefings on the topics you follow, researched fresh for each period. Learn more →
Make the visual, then fix only what’s wrong
Describe it, start from a template or start from research. Box what needs to change; keep everything else.