
1. Key takeaways from the window
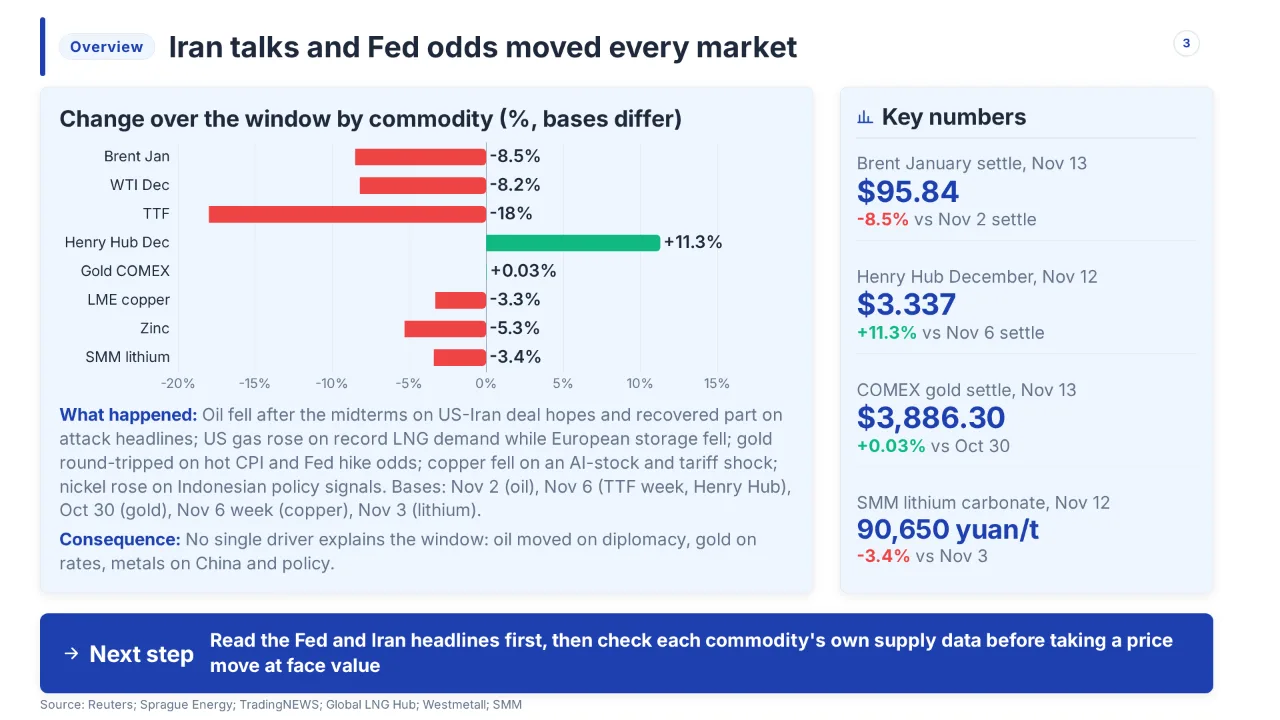
Between Nov 3 and Nov 16, 2026, commodity prices were set by US-Iran peace hopes after the US midterm elections, by a hot October CPI and jobs report that put a December Fed hike in the price, and by supply and policy news in metals. Five conclusions explain the window; each is supported in the chapters named in brackets, with every fact judged against Nov 17.

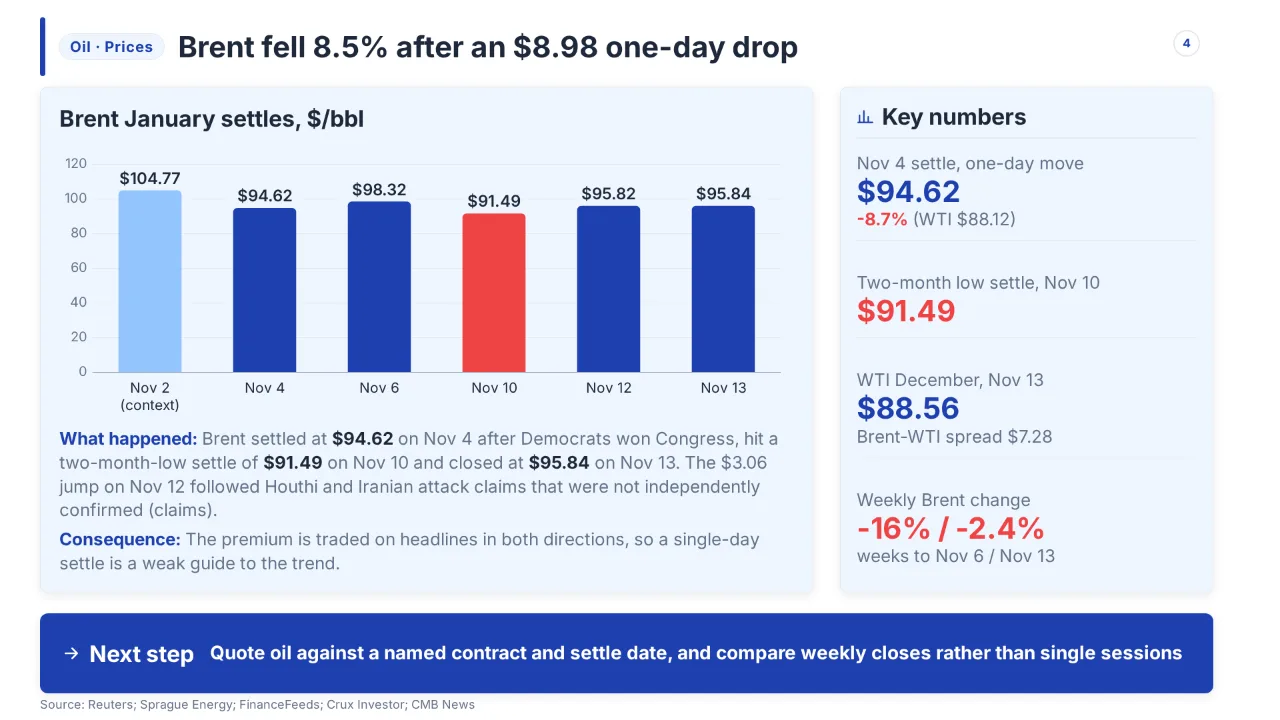
1. Oil gave back most of its war premium, then rebuilt part of it on attacks. Brent settled at $104.77 on Nov 2, fell 8.7% to $94.62 on Nov 4 after Democrats won Congress, touched a $91.49 settle on Nov 10, and closed at $95.84 on Nov 13, about 8.5% below the Nov 2 settle. The IEA said supply passed demand in October for the first time since the war began, with stocks up 52 mb, while attacks on shipping and Saudi sites (some unverified claims) kept pulling prices back up. OPEC+ made no new decision in the window; December targets were held on Nov 1 (context). [Chapter 2]
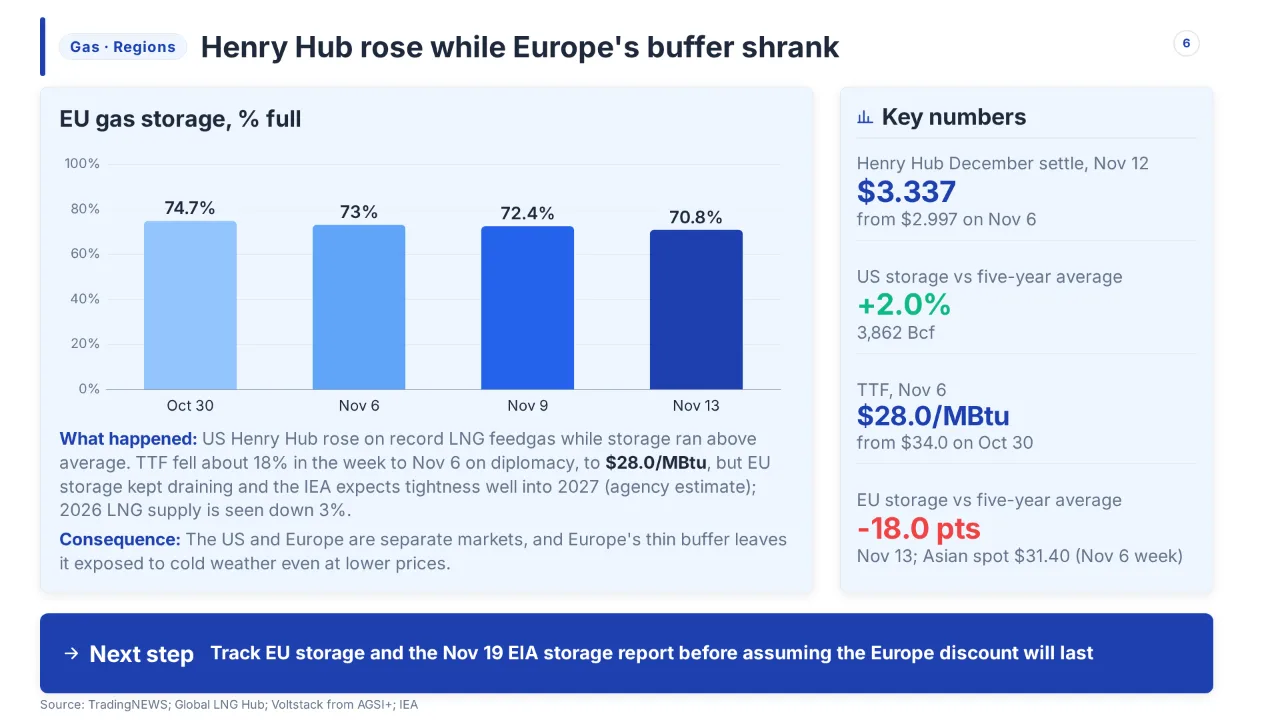
2. Gas split in two: higher in the US, lower but still dear in Europe and Asia. Henry Hub December settled at $3.337 on Nov 12, up 11.3% from $2.997 on Nov 6, on record LNG feedgas above 20 Bcf/d, while US storage was 2.0% above its five-year average. TTF fell about 18% in the week to Nov 6 to $28.0/MBtu on diplomacy, yet EU storage dropped to 70.8% on Nov 13, 18.0 points under the five-year average. The IEA expects 2026 LNG supply to fall 3% and sees tightness lasting into 2027. [Chapter 3]
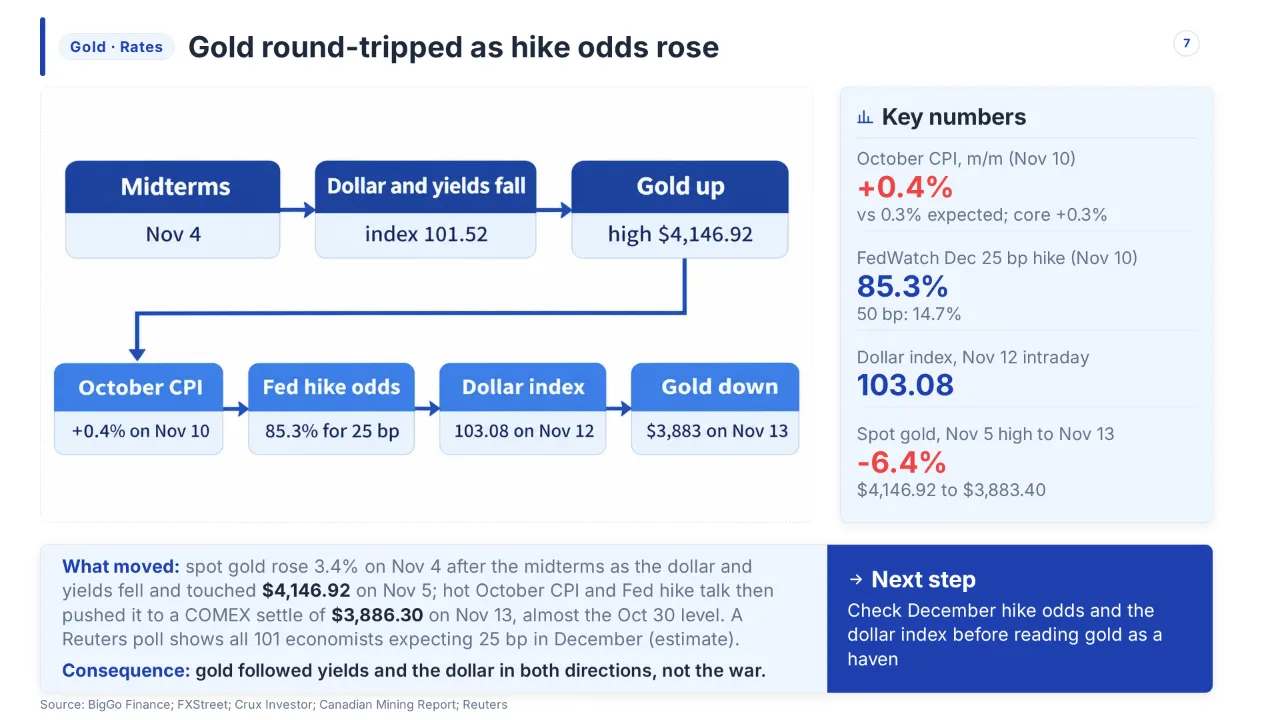
3. Gold took a round trip: up on the midterms, down on the Fed. Spot gold rose 3.4% on Nov 4 and touched $4,146.92 on Nov 5, then fell on hot CPI and a stronger dollar to about $3,883 on Nov 13, 6.4% below the high; the COMEX settle of $3,886.30 matches the $3,885 of Oct 30. FedWatch put a 25 bp December hike at 85.3% on Nov 10, and Goldman cut its year-end target to $4,150 (estimate). Central banks bought 321 t in Q3 (+42%). [Chapters 4 and 7]
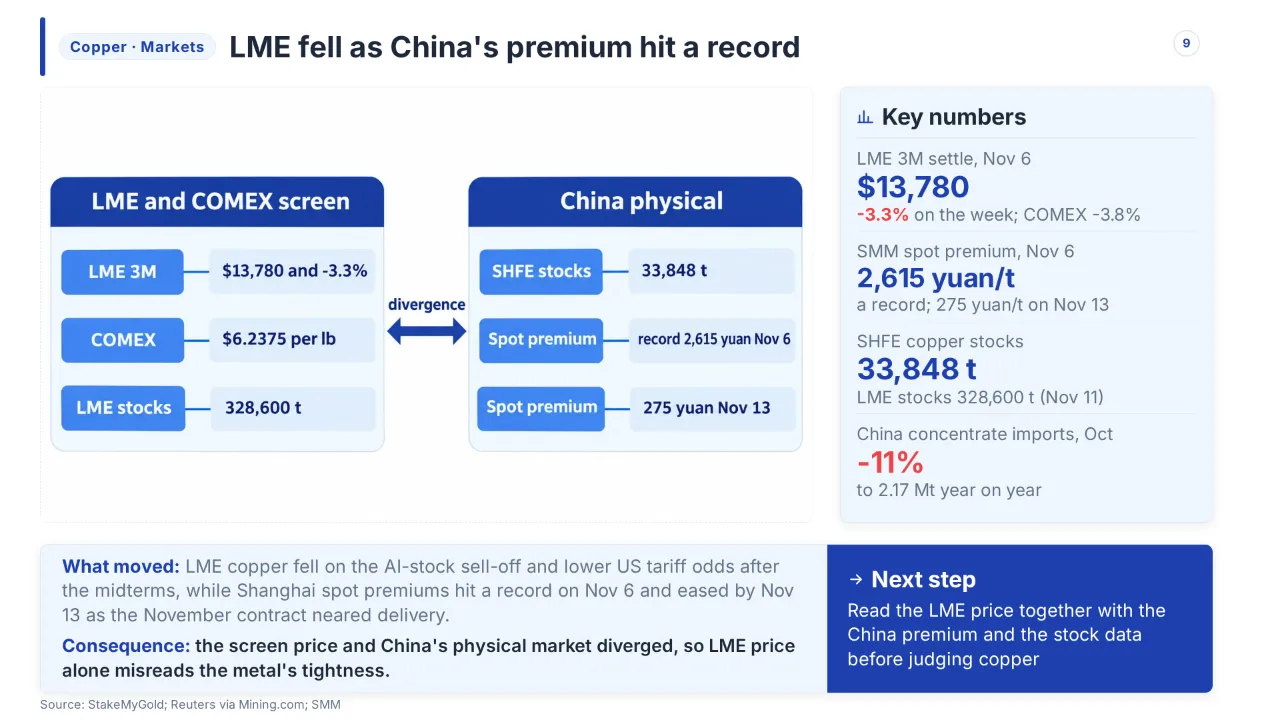
4. Base metals fell on a demand and tariff shock while China's physical market tightened; lithium stayed low and nickel rose on Indonesian policy. LME three-month copper settled at $13,780 on Nov 6, 3.3% lower on the week, as the AI-stock sell-off and lower tariff odds hit prices, while SHFE stocks fell to 33,848 t and China's spot premium reached a record 2,615 yuan/t before easing to 275 yuan/t. Zinc fell 5.3% and iron ore 3.3%. SMM lithium carbonate averaged 90,650 yuan/t on Nov 12, 5.7% below Oct 29; LME nickel rose above $16,000/t on signals of deeper Indonesian 2027 quota cuts. [Chapters 5 and 6]
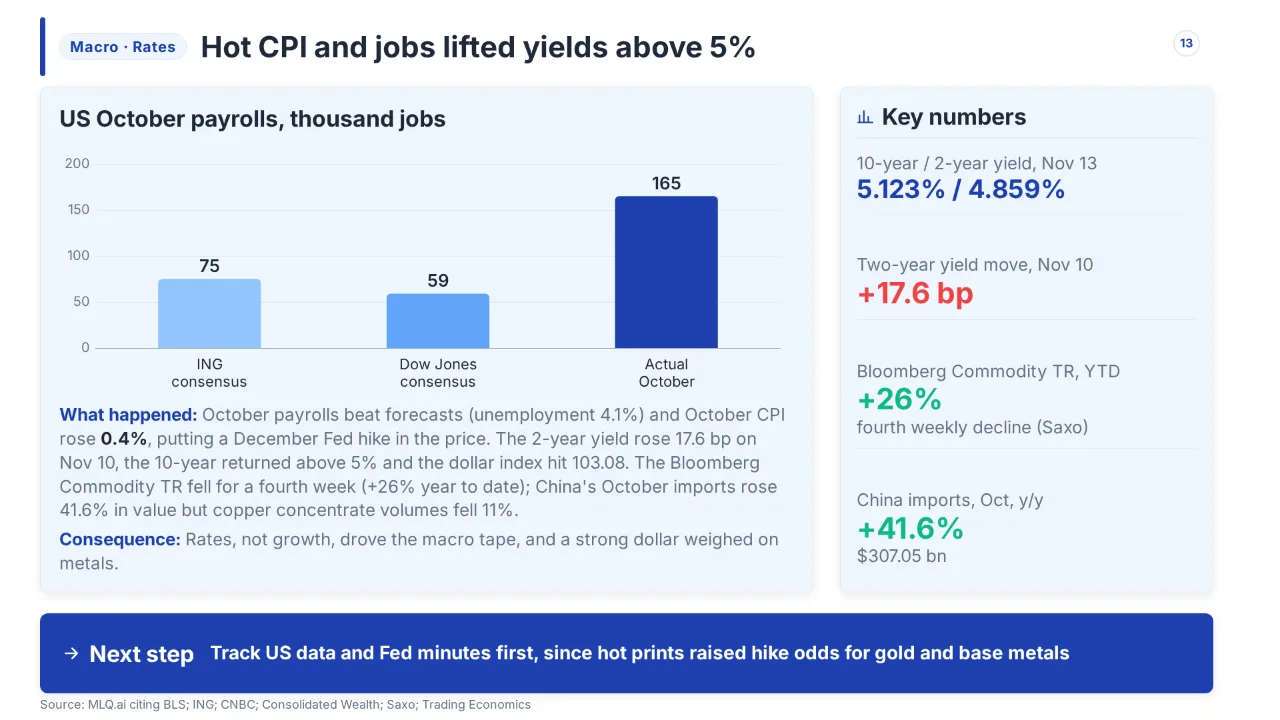
5. Rates, not growth, drove the macro tape. October payrolls rose 165,000 and CPI rose 0.4% (core 0.3%); the 10-year yield returned above 5%, the dollar index reached 103.08 intraday and the Bloomberg Commodity Total Return Index fell for a fourth week to a three-month low, still +26% year to date (Saxo analyst view). China's October imports rose 41.6% in value, but copper concentrate volumes fell 11%. [Chapter 7]
1.1 Prices at a glance
Levels mix settles, intraday quotes and averages; each row keeps its own benchmark and date. "Derived" means our arithmetic from the cited chapter, and bases marked "context" predate Nov 3.
| Commodity | Level | Change over the window | Date | Main driver | Source |
|---|---|---|---|---|---|
| Brent Jan futures, USD/bbl | $95.84 settle | -8.5% vs $104.77 on Nov 2 (context, derived) | Nov 13 | US-Iran deal hopes, supply recovery, attack headlines | FinanceFeeds; Sprague |
| WTI Dec futures, USD/bbl | $88.56 settle | -8.2% vs $96.46 on Nov 2 (context, derived) | Nov 13 | Same as Brent; US stocks +4.7 mn bbl | CMB News; Sprague |
| Henry Hub Dec futures, USD/MMBtu | $3.337 settle | +11.3% vs $2.997 on Nov 6 (derived) | Nov 12 | Record LNG feedgas, cold forecast, crowded short | TradingNEWS |
| TTF Dec, USD/MBtu | $28.0 (Global LNG Hub) | -18% vs $34.0 on Oct 30 (context) | Nov 6 | Diplomacy hopes, more regasification | Global LNG Hub |
| Gold, USD/oz | $3,886.30 COMEX settle | +0.03% vs $3,885 on Oct 30 (context); -6.4% from the Nov 5 spot high (derived) | Nov 13 | Hot CPI, Fed hike odds, stronger dollar | Canadian Mining Report; BigGo |
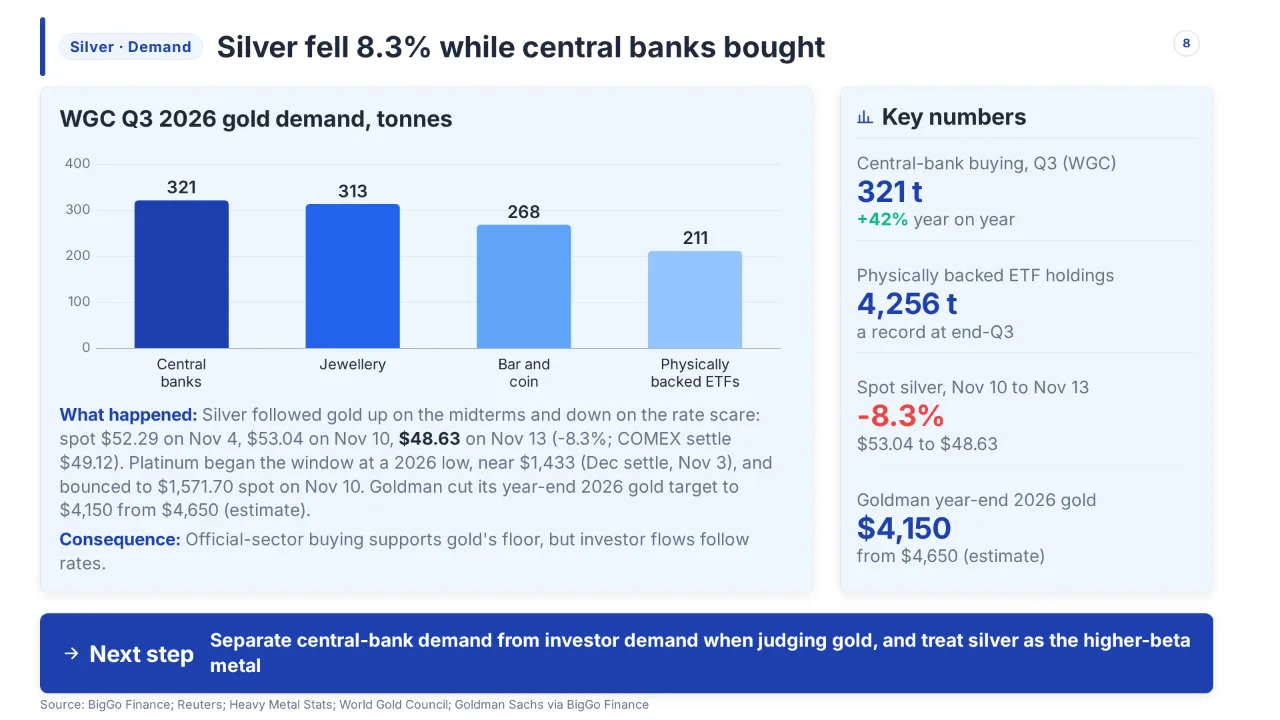
| Silver, USD/oz | $49.12 COMEX settle | Spot -8.3% from $53.04 on Nov 10 to $48.63 (derived) | Nov 13 | Same as gold | Canadian Mining Report; Reuters |
| LME copper 3M, USD/t | $13,780 settle | -3.3% on the week to Nov 6 | Nov 6 | AI sell-off, lower tariff odds; tight China physical | StakeMyGold |
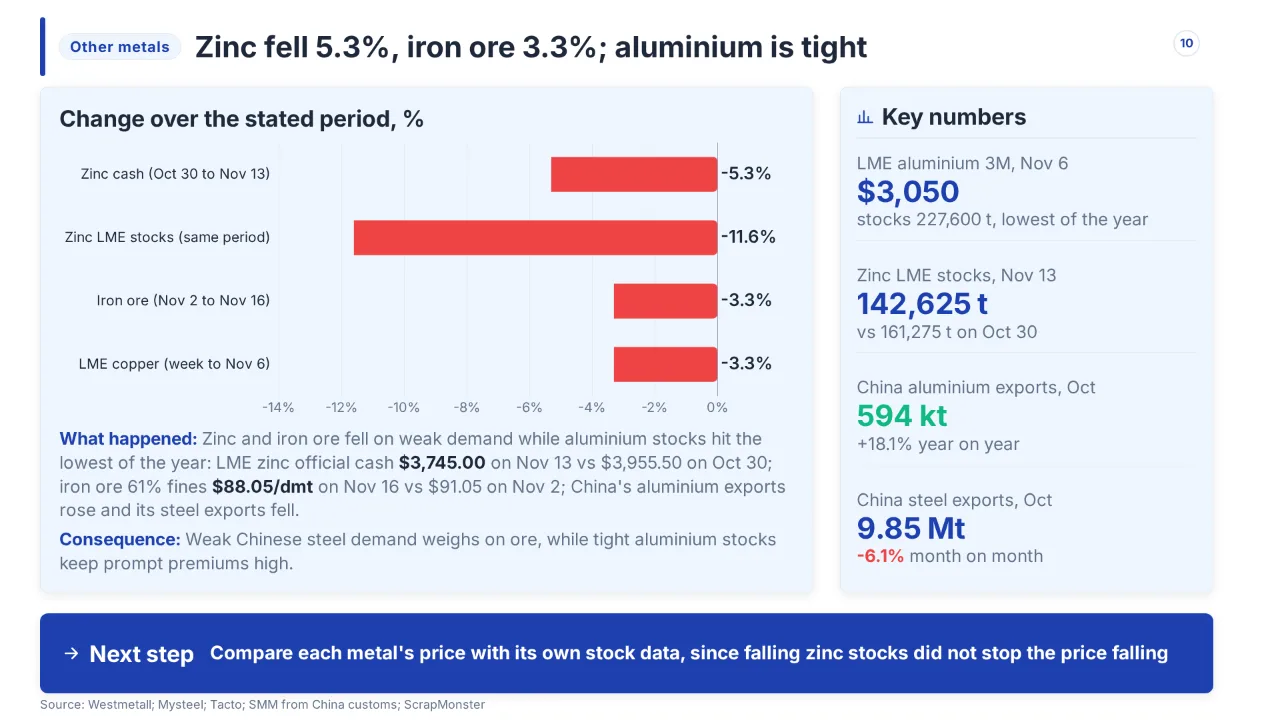
| LME zinc cash, USD/t | $3,745.00 official | -5.3% vs $3,955.50 on Oct 30 (context, derived) | Nov 13 | Weak demand; stocks fell 11.6% | Westmetall |
| Iron ore 61% fines, USD/dmt CFR Qingdao | $88.05 | -3.3% vs $91.05 on Nov 2 (context, derived) | Nov 16 | Weak steel demand, high port stocks | Mysteel |
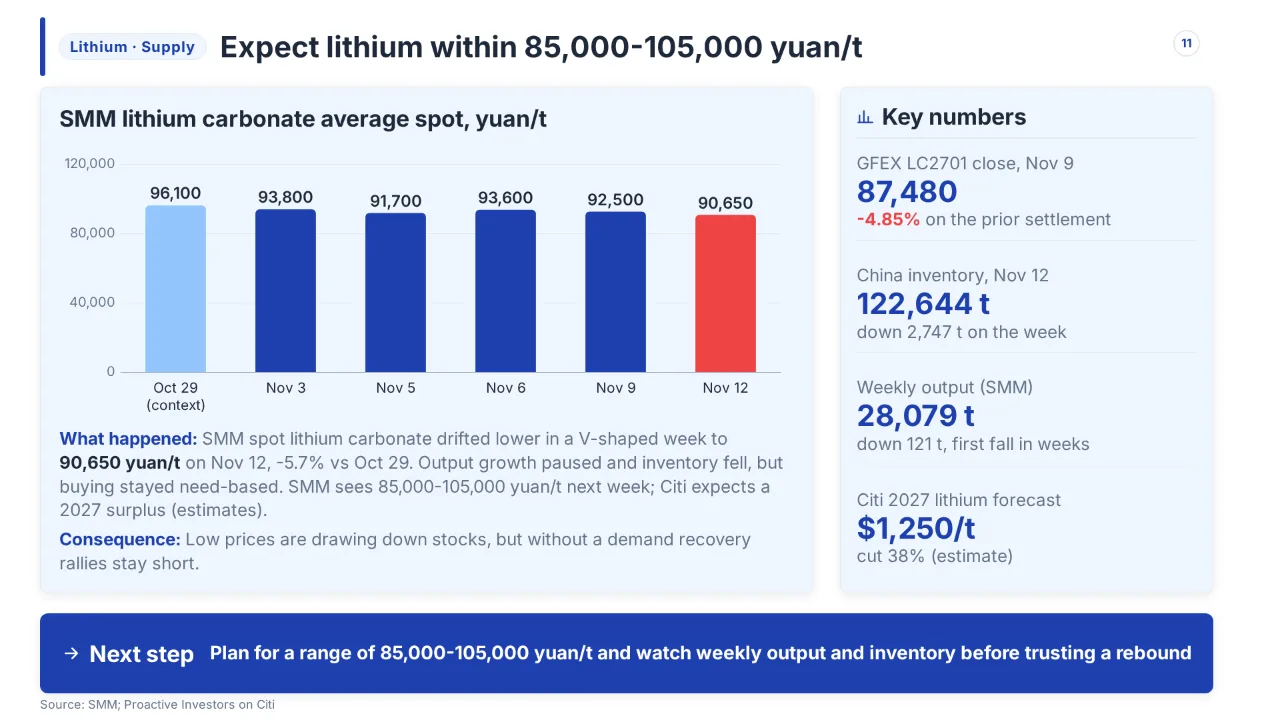
| SMM lithium carbonate, yuan/t | 90,650 average spot | -3.4% vs 93,800 on Nov 3 (derived) | Nov 12 | Rising output, need-based buying | SMM |
| LME nickel 3M, USD/t | $16,285 | No window change computed | Nov 6 | Indonesian quota cut signals | Reuters via Mining.com |
2. Energy: oil and OPEC+
Oil set the tone for the whole window: between Nov 3 and Nov 13 the war premium that had carried Brent to a $117.64 settle on Oct 30 (context, December contract at expiry) was largely unwound, then partly rebuilt on every attack headline.
Brent settled at $95.84 on Fri Nov 13, about 8.5% below the $104.77 January-contract settle of Mon Nov 2, after touching a $91.49 settle on Nov 10. The IEA says supply overtook demand in October for the first time since the war began.
2.1 Oil at a glance: settles, inventories and agency views
All Brent figures are ICE futures settles for the front-month January contract unless a row says otherwise; WTI is the December NYMEX contract.
| Item | Key figure | Date | Status | Source |
|---|---|---|---|---|
| Brent Jan settle (base, context) | $104.77, down $8.66 | Nov 2 | Reported | Sprague Energy |
| Brent settle | $103.60 (derived: $94.62 + $8.98) | Nov 3 | Derived | Reuters |
| Brent settle / WTI settle | $94.62 (-8.7%) / $88.12 (-8.3%) | Nov 4 | Reported, lowest since Aug 31 | Reuters |
| Brent settle | $98.32 | Nov 6 | Reported | FinanceFeeds |
| Brent settle | $91.49 (intraday low $89.16 on Nov 11) | Nov 10 | Reported, two-month low | Crux Investor |
| Brent settle | $95.82 (+$3.06, +3.3%) | Nov 12 | Reported | FinanceFeeds |
| Brent settle / WTI Dec settle | $95.84 / $88.56 | Nov 13 | Reported | FinanceFeeds; CMB News |
| US commercial crude stocks | -0.865 mn bbl to 409.8 mn bbl | Week to Oct 30 (EIA, Nov 4) | Reported | Reuters |
| US commercial crude stocks | +4.7 mn bbl to 414.4 mn bbl | Week to Nov 6 (EIA, Nov 12) | Reported; poll expected -1.1 mn | Reuters via Business Times |
The window change follows from the bases above. Brent eased about $1.17 on Nov 3 and fell a further $8.98 on Nov 4, so from the Nov 2 base the Nov 4 settle is ($94.62 - $104.77) / $104.77 = -9.7%, and the Nov 13 settle is ($95.84 - $104.77) / $104.77 = -8.5%. Against the Oct 30 January settle of $113.43 (context), the same Nov 13 settle is -15.5%. WTI December went from $96.46 (Nov 2) to $88.56 (Nov 13), or ($88.56 - $96.46) / $96.46 = -8.2%. Brent over WTI was $7.28 on Nov 13 ($95.84 - $88.56).
2.2 Why prices fell, then bounced
The fall (Nov 3-4, decision-driven). Reuters tied the Nov 4 sell-off to the midterm result: Republicans lost both chambers of Congress, and investors bet that a weaker President Trump, facing a Democratic Congress able to constrain his options, would move toward a deal with Iran (analyst and Gulf-source views, not an official statement). Trump said on Nov 3 that the US had no immediate plans to strike Iran, and Qatar stepped up mediation. A senior Iranian official said the two sides remained far from a deal, and Enverus warned of escalation before resolution. Weekly moves were large: Brent fell about 16% and WTI 13% in the week to Nov 6; the Brent figure is measured from the expiring December contract's $117.64, and against the January contract's $113.43 the fall to the $98.32 settle of Nov 6 is ($98.32 - $113.43) / $113.43 = -13.3%. Vantage, a broker, put Brent's fall at about 21% from the start of November to Nov 11 (broker analysis, its own base).
The bounce (Nov 10-13, attack-driven). After the Nov 10 low, Brent rebounded 1.1% to $92.53 intraday on Nov 11 as 37 ships were attacked in and around Hormuz in October, the highest monthly count of the war, and 10 more in early November, according to the Washington Institute for Near East Policy. On Nov 12 Brent settled $3.06 (3.3%) higher at $95.82 after the Houthis claimed hits on a Saudi East-West pipeline pumping station, a Yanbu oil facility and an Aramco building, and Iran's military said four tankers were hit by explosions; none was independently confirmed at the settle and Reuters could not verify the tanker claim (claims). Saudi-led coalition forces said they intercepted two drones. Brent held at $95.84 on Nov 13 as Trump said a deal was not needed and the US blockade would continue; Brent finished the week about 2.4-2.5% lower, its second weekly fall. A Qatari-brokered Iranian proposal on Hormuz reached the White House around Nov 9, and Brent fell 3.6% to $94 that day (OilPrice.com via a broker note). Claims on Nov 14-15 of mines striking tankers fall in the window but could not be verified.
2.3 Supply, inventories and OPEC+
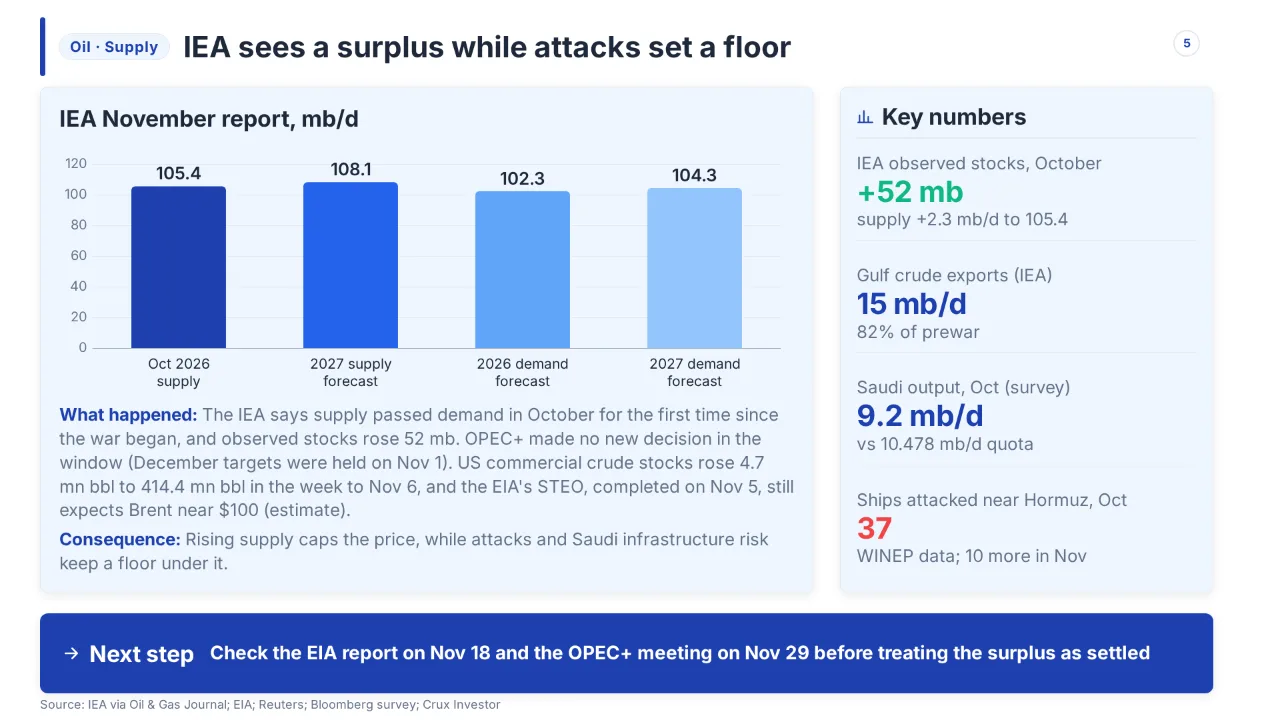
The IEA's Nov 13 Oil Market Report (agency estimate and data) is the strongest evidence of rebalancing: world supply rose 2.3 mb/d in October to 105.4 mb/d, after +3 mb/d in September; observed inventories rose 52 mb (1.7 mb/d); Gulf crude exports reached 15 mb/d, 82% of prewar. North Sea Dated fell 32% from $136 on Oct 8 to about $93 at the time of writing, still $22 above prewar. The IEA sees 2026 demand down 2.7 mb/d to 102.3 mb/d and a 2 mb/d rebound to 104.3 mb/d in 2027, while supply is forecast to fall 4.8 mb/d in 2026 and rebound by 6.6 mb/d to 108.1 mb/d in 2027; diesel remains the overriding concern. Vortexa ship-tracking showed Gulf exports of crude, condensate and products at 17.1 mb/d in October, from 18.9 mb/d in September, about three-quarters of prewar (a different measure from the IEA's 18.4 mb/d, which excludes Oman).
The EIA's November Short-Term Energy Outlook (released Nov 10, forecast completed Nov 5, so before most of the sell-off) still expects Brent to stay near $100 for the rest of 2026 and fall to $77 in Q4 2027; it put US commercial crude stocks at 410 mn bbl at end-October, the lowest end-October level since 2014. The Nov 12 build of 4.7 mn bbl to 414.4 mn bbl ended five straight weekly draws. OPEC's November report (Nov 11) left its 2026 and 2027 demand forecasts unchanged, according to Quantum; an analyst summary of the report cites 2026 growth of 0.2 mb/d and 2027 growth of 2.6 mb/d.
OPEC+ itself made no new decision in the window. The seven core members held December targets at their Nov 1 online meeting (context, decision). October output recovered: a Bloomberg survey put Saudi production at 9.2 mb/d (+970 kb/d) and OPEC at 22.8 mb/d, still about 1.28 mb/d under Saudi Arabia's 10.478 mb/d quota (10.478 - 9.2); a Reuters survey gave OPEC 22.87 mb/d. A secondary summary reports Saudi Arabia telling OPEC it produced 10.6 mb/d; the surveys and that figure differ, and we follow the survey because the summary is an AI-generated aggregator. A ministerial meeting on Nov 29 is said to set 2027 targets (upcoming, secondary source).
3. Energy: natural gas and LNG
Gas followed oil down on the Iran headlines in the first week, then split: Henry Hub rose on record LNG feedgas, while European and Asian benchmarks stayed on crisis pricing with storage draining faster than usual.
Dutch TTF fell about 18% in the week to Nov 6 (from $34.0 to $28.0/MBtu), yet EU storage dropped to 70.8% full on Nov 13, 18.0 points under the five-year average. Henry Hub moved the other way, up 7.8% on the week to about $3.23.
3.1 Gas at a glance
Units are USD per MBtu unless stated. TTF and JKM here are Global LNG Hub (an industry data provider) readings of JOGMEC assessments; Henry Hub futures are the December NYMEX contract.
| Item | Key figure | Date | Status | Source |
|---|---|---|---|---|
| TTF (Dec delivery) | $28.0, from $34.0 on Oct 30 (about -18%) | Nov 6 | Reported weekly assessment | Global LNG Hub |
| TTF in euros | EUR 86/MWh, down almost 17% from EUR 104/MWh | Nov 6 | Reported | Pipeline & Gas Journal |
| JKM (Dec delivery) | Low $32s from low $34s on Oct 30 | Nov 6 | Reported | Global LNG Hub |
| Asian spot LNG, week average | $31.40, from $32.50 (highest since Dec 2022) | Week to Nov 6 | Reported | Pipeline & Gas Journal |
| Henry Hub Dec futures settle | $2.997 | Nov 6 | Reported | TradingNEWS |
| Henry Hub Dec futures settle | $3.217 (+22 cents, +7.34%) | Nov 9 | Reported | TradingNEWS |
| Henry Hub Dec futures settle | $3.337 (high of $3.397 on Nov 11, intraday) | Nov 12 | Reported | TradingNEWS |
| EU gas storage, % full | 73.0% (74.7% on Oct 30) | Nov 6 | Reported | Global LNG Hub, from AGSI+ |
| EU gas storage, % full | 70.8% (801 of 1,132 TWh) | Nov 13 | Reported | Voltstack tracker, from AGSI+ |
| US working gas in storage | 3,862 Bcf (+61 Bcf) | Week to Nov 6 | Reported | EIA via TradingNEWS |
3.2 Henry Hub: record LNG demand against a growing storage surplus
Henry Hub is the one benchmark in this report that gained. The December contract settled at $2.997 on Nov 6, jumped $0.22 (7.34%) to $3.217 on Nov 9, the biggest one-day rally of the autumn per TradingNEWS, settled $3.215 on Nov 11 after an intraday high of $3.397, and closed Nov 12 at $3.337. From Nov 6 to Nov 12 that is ($3.337 - $2.997) / $2.997 = +11.3%. A late-Friday quote of $3.23 on Nov 13 is intraday, not a settle, and is 7.8% above the Nov 6 settle; a broker note put the Nov 13 weekly close at $3.242, up 8.1% on the week. Against the previous issue's Henry Hub November contract at $2.602 (context, expiry on Oct 26) the December contract is a different month, so we do not compute a change.
Drivers were mixed. US LNG terminals took more than 20 Bcf/d of feedgas, a record, and speculative funds held a record net short, which made rallies sharp (TradingNEWS). Against that, storage kept building faster than normal. The EIA reported a 77 Bcf injection to 3,801 Bcf for the week ended Oct 30, 1.4% above the five-year average and 2.8% below last year; NGI put the surplus at 54 Bcf. The next report, for the week ended Nov 6, showed +61 Bcf to 3,862 Bcf, against a five-year average injection of 40 Bcf, so the surplus widened by 21 Bcf to about 75 Bcf (54 + 21), or 2.0% above average and 2.3% below last year. TradingNEWS's headline says the surplus is "54 Bcf"; that figure belongs to the prior week, and we follow the percentage. The EIA's November Short-Term Energy Outlook (Nov 10) raised its end-November storage forecast by almost 70 Bcf after a warm start and cut its November-March Henry Hub spot average to $2.87, 16% below its October forecast (estimate). The next storage report, for the week ended Nov 13, is due Nov 19 (upcoming).
3.3 Europe and Asia: lower prices, thinner buffers
TTF's drop was driven by the same diplomacy as oil. Global LNG Hub tied the move to Trump's cautious stance on strikes (Nov 2), the midterm result (TTF at $29.1 on Nov 4) and a sharp rise in regasification volumes. Argus attributed the weekly price fall to a shift toward de-escalation from Trump and expected Qatari supply, with loadings "well above half of capacity" (analyst view). JKM nonetheless stayed near a four-year high, because, in Davenport Energy's words, "the whole market remains structurally tight heading into winter".
The physical position worsened. Estimated European gas demand ran more than 20% above seasonal expectations in the week reported on Nov 11, up 25% week on week, and storage withdrawals were, in European Gas Hub's words (a data provider), "by far the highest level for the first week in recent records". EU storage fell from 74.7% on Oct 30 to 73.0% on Nov 6 and 72.4% on Nov 9, then to 70.8% on Nov 13, a loss of 2.2 points in the last week (73.0 - 70.8). The Nov 13 level is 18.0 points below the five-year average of 88.8% and below the five-year minimum for the date.
3.4 What the IEA says
The IEA's Global Gas Security Review 2026, published Nov 3 together with its Q4 gas market analysis, is the agency view: global LNG supply will fall 3% (almost 20 bcm) in 2026 and global gas demand about 1.5% (close to 65 bcm); the effective halt of Hormuz LNG flows cut Qatari and Emirati loadings by more than 60 bcm between March and October; EU storage enters winter at its lowest since 2013, so tightness could last well into 2027 (agency estimate). Crux Investor adds that Hormuz carried about 20% of global LNG before the war, and that output outside the Gulf rose 14% (more than 40 bcm). A reopening would help only gradually, because Europe would already be drawing down storage.
4. Precious metals
Where oil and gas fell on peace hopes, gold took the same news two ways: the midterm result lifted it above $4,100, and hot US inflation then pushed it back to where it started.
Spot gold rose from about $3,928 before the midterms (derived from the +3.4% on Nov 4) to a $4,146.92 intraday high on Nov 5, then fell to $3,883.40 at the Nov 13 close, about 6.4% lower. The COMEX settle of $3,886.30 on Nov 13 is almost exactly the $3,885 of Oct 30: a round trip driven by the dollar and Fed hike odds.
4.1 Gold, silver, platinum and palladium at a glance
Spot quotes are intraday readings from the named outlet; COMEX and NYMEX rows are futures settles; the LBMA PM price is the benchmark auction.
| Item | Key figure | Date | Status | Source |
|---|---|---|---|---|
| Spot gold | $4,061.30 (+3.4% on the day); $4,146.92 intraday high on Nov 5 | Nov 4-5 | Reported | BigGo Finance |
| LBMA gold PM | $4,049.60 | Nov 6 | Benchmark | Crux Investor, citing LBMA |
| Spot gold | $4,115.12 at 02:38 GMT, with the Dec futures at $4,123.90 | Nov 10 | Intraday | Reuters |
| Spot gold | $3,931.54 by 09:12 GMT (-1.4%), third straight decline | Nov 12 | Intraday | Crux Investor |
| COMEX Dec gold settle / spot close | $3,886.30 / about $3,883.40 | Nov 13 | Reported | Canadian Mining Report (via Kitco) |
| Spot silver | $52.29 (+5.1%); $53.04 on Nov 10 | Nov 4; Nov 10 | Intraday | BigGo Finance; Reuters |
| COMEX silver settle / spot silver | $49.12 / about $48.63 | Nov 13 | Reported | Canadian Mining Report |
| NYMEX platinum Dec / palladium Dec settle | about $1,433 / $933.60, both 2026 lows | Nov 3 | Reported | Heavy Metal Stats |
| Spot platinum / palladium | $1,571.70 / $1,037.50 | Nov 10 | Intraday | Reuters |
4.2 Why gold rose, then fell
Up (Nov 4-6): politics, dollar and yields. Democrats won both chambers, and markets read a divided government as less fiscal spending and less Treasury supply. The 10-year yield fell to 4.87%, the dollar index dropped about 0.3% to near 101.5, and spot gold gained 3.4% on Nov 4. Citi set a short-term gold target of $4,500 on the prospect of Hormuz reopening (analyst view, from a secondary summary). Falling oil also helped, because lower energy prices eased inflation worries (analyst view).
Down (Nov 10-13): inflation and the Fed. BLS reported on Nov 10 that October CPI rose 0.4% month on month against 0.3% expected, with core at 0.3% against 0.2%; BLS published no annual rate because of last year's shutdown gap. Spot gold fell about 2.2% intraday to around $4,050 from Monday's high near $4,148. CME FedWatch showed 85.3% for a 25 bp December hike and 14.7% for 50 bp that day; Crux Investor cited 89% and 11% after the data. Fed Governor Waller said a half-point move "may be needed" if core CPI ran at 0.3% or higher, and Dallas Fed President Logan saw a case for at least two more quarter-point hikes (official statements, as reported). A Reuters poll of Nov 6-10 found all 101 economists expecting a 25 bp December hike; 56 saw it as the last of the cycle and 45 saw at least two more (estimate). On Nov 12 spot gold fell 1.4% to $3,931.54 as the dollar hit a 19-month high, and an intraday low of about $3,852, the lowest since October 2025, was reported that week. A broker note put the Nov 13 weekly close at $3,883.94, down 4.56% on the week, gold's tenth weekly loss in twelve.
Window arithmetic: from the Nov 5 spot high of $4,146.92 to the Nov 13 spot close of $3,883.40 is ($3,883.40 - $4,146.92) / $4,146.92 = -6.4%. Against the COMEX settle of $3,885 on Oct 30 (context), the Nov 13 settle of $3,886.30 is +$1.30, or +0.03%. For context, gold fell 6.3% in October in dollar terms, according to the World Gold Council.

4.3 Silver, platinum and palladium
Silver amplified gold: spot rose 5.1% to $52.29 on Nov 4 and reached $53.04 on Nov 10, then fell to about $48.63 on Nov 13; the weekly loss was 6.18%, to $48.70, per a broker note. That is a fall of about 8.3% from Nov 10 ($48.63 / $53.04 - 1). The COMEX settle of $49.12 on Nov 13 is identical to the Oct 30 spot close in the previous issue, so the window is flat on that comparison, though the two series are different benchmarks. Platinum and palladium began the window at 2026 lows: Dec platinum settled near $1,433 and palladium at $933.60 on Nov 3, down 47.8% and 54.0% year to date, with WPIC expecting a 265 koz platinum surplus and Nornickel a 0.3 Moz palladium surplus (industry estimates). By Nov 10 spot platinum was $1,571.70, about 9.7% above the Nov 3 settle ($1,571.70 / $1,433 - 1) with the caveat that spot and futures differ.
4.4 Demand and forecasts
The World Gold Council's Q3 report (Nov 3) shows why central banks, not investors, carried the market: demand was 1,369 t (-1% y/y), central banks bought 321 t (+42%, the most since Q4 2024; 675 t year to date, +6%), ETFs added 211 t to a record 4,256 t, while jewellery fell 17% to 313 t, the weakest third quarter in the series, and bar and coin fell 19% to 268 t. The Q3 LBMA PM average was $4,262/oz, so the Nov 13 spot close is 8.9% below it ($3,883.40 / $4,262 - 1). Goldman Sachs (Nov 5, per secondary summaries) cut its year-end 2026 target to $4,150 from $4,650 and its year-end 2027 target to $4,800 from $5,400, assuming a December hike, while keeping 60 t a month of central-bank buying (against 17 t before 2022; its nowcast is about 85 t) (estimate, not our view). The material has no dated November ETF flow figure. Upcoming: the October PPI on Nov 13, the Fed decision on Dec 9 and the November CPI on Dec 10.
5. Industrial metals
After gold's round trip, base metals fell for a different reason: copper took the midterm result and the AI-stock sell-off as a demand and tariff shock, while China's physical market tightened to record premiums.
LME three-month copper settled at $13,780 on Nov 6, down 3.3% on the week, its steepest weekly loss since March. In Shanghai, the spot premium hit a record 2,615 yuan/t and exchange stocks fell to 33,848 t, under a day of Chinese consumption.
5.1 Industrial metals at a glance
Prices are LME three-month unless stated; Chinese figures are SMM (an industry data provider) assessments or customs data. The material has no LME copper close for Nov 12-13, so the latest copper levels are Nov 6-11 readings and a COMEX weekly close.
| Item | Key figure | Date | Status | Source |
|---|---|---|---|---|
| LME copper 3M settle | $13,780, -3.3% on the week | Nov 6 | Reported | StakeMyGold |
| LME copper 3M, official open outcry | $13,775; intraday low $13,636, lowest since Jul 30 | Nov 6 | Intraday | Reuters via Mining.com |
| COMEX Dec copper settle | $6.2375/lb, -3.8% on the week (from $6.482) | Nov 6 | Reported | StakeMyGold |
| COMEX copper weekly close | $6.0635/lb, -2.79%, four-month low | Nov 13 | Broker note | Capital Street FX |
| LME copper stocks | 316,675 t (Nov 6); 328,600 t (Nov 11) | Nov 6; Nov 11 | Reported | StakeMyGold; SMM |
| SHFE copper stocks | 33,848 t, -24% on the week, lowest in almost three years | Week to Nov 6 | Reported | Reuters via Mining.com |
| SHFE spot premium (SMM #1 cathode) | Record 2,615 yuan/t average; 275 yuan/t on Nov 13 | Nov 6; Nov 13 | Reported | SMM |
| LME aluminium 3M / stocks | $3,050 close / 227,600 t, lowest of the year | Nov 6 | Reported | Tacto |
| LME zinc official cash / stocks | $3,745.00 / 142,625 t | Nov 13 | Reported | Westmetall |
| Iron ore 61% fines, CFR Qingdao | $88.05/dmt, -2.49% on the day | Nov 16 | Reported | Mysteel |
5.2 Copper: financial selling against a tight physical market
Copper's fall had three drivers, all stated by market sources rather than officials. First, the AI equity sell-off after the midterm result cut demand expectations for data centres; on Nov 3 and Nov 5 copper lost about 2.5% each day, and Texas Governor-elect Hinojosa proposed a moratorium on new data-centre permits (CNBC, reported on Nov 5). Second, the result lowered the odds of US tariffs on refined copper: Deutsche Bank's Daniel Ghali noted the "reduced potential" for tariffs, and the COMEX premium over LME briefly flipped to a discount before settling near $80/t, against more than $700 in August. Third, funds cut their net long in COMEX copper to 34,444 contracts from 82,649 in mid-September. Over the week to Nov 6 COMEX fell 3.8% and LME 3.3%, the worst since March. A rebound followed (LME $13,908, +1%, per Crux Investor), then CPI pressure; ADM put LME at $13,730 after a 1.2% fall in the days after the Nov 10 CPI. COMEX closed Nov 13 at $6.0635, 2.79% lower on the week, and 12.0% under its record close of $6.8885 on Sep 9 ($6.0635 / $6.8885 - 1).
China told a different story. SMM assessed the spot premium at a record average 2,615 yuan/t on Nov 6, up 515 yuan/t in a day, with SMM-tracked cathode stocks at about 62,600 t on Nov 5 against 134,400 t a year earlier, and SHFE stocks down to 33,848 t. The Yangshan import premium reached a record $217.50/t (Reuters) or $230/t (ADM). Cathode imports for January-September were down 16.34% year on year, as metal went to the US ahead of tariffs; more than 70% of LME stocks sat in US warehouses on Nov 5. LME stocks kept rising, from 273,750 t on Oct 23 (context) to 328,600 t on Nov 11, or +20% (328,600 / 273,750 - 1), mostly in New Orleans. By Nov 13 the Shanghai premium had collapsed to 275 yuan/t as the November contract neared delivery and suppliers sold, though stocks stayed at historical lows. October customs data confirm tight feedstock: copper concentrate imports fell 11% year on year to 2.17 Mt (2.48 Mt in September), and smelters face negative processing fees. Imports of unwrought copper and products were 453 kt, +3.4% on the year, but down 5.5% for January-October at 4.211 Mt.

5.3 Aluminium, zinc and iron ore
Aluminium is tight but dropped on easing Middle East risk and Chinese exports. LME 3M closed at $3,050 on Nov 6, 3.1% below Oct 6, with stocks at 227,600 t, the lowest of the year. ADM put it at $2,995 (-2.3%), with the cash premium over three-month at $94, a five-month high, and available stocks at 207,525 t, of which 99.98% is Russian-origin metal that many Western traders avoid (commentary, date not stated, around Nov 10). China's unwrought aluminium and products exports were 594 kt in October, +18.1% on the year, and 5.914 Mt for January-October, +17.8%. A Reuters poll projects a 2027 surplus of 410 kt after a 2026 deficit of 720 kt (estimate).
Zinc was the clearest loser in the Westmetall series: official cash fell from $3,955.50 on Oct 30 (context) to $3,745.00 on Nov 13, or -5.3% (($3,745.00 - $3,955.50) / $3,955.50), while stocks dropped 11.6% from 161,275 t to 142,625 t.
Iron ore drifted lower on weak steel demand. Mysteel's SEADEX 61% fines index fell to $88.05/dmt on Nov 16, 2.49% in one day; against $91.05 on Nov 2 (context, same index) that is -3.3% ($88.05 / $91.05 - 1). Imported ore stocks at 47 ports rose 1.4% on the week to 175.3 Mt as of Nov 5, the highest since late June (Mysteel). Customs data show October iron ore imports of 105.66 Mt and 1,060.6 Mt for January-October, +3.1% on the year, while steel exports fell 6.1% in the month to 9.85 Mt. Mysteel said Chinese import prices fell again in the week of Nov 9-13 as "fundamentals remained weak".
6. Battery metals
Battery metals did not follow oil or gold. Lithium kept grinding lower on supply growth and weak demand, nickel jumped on Indonesian policy signals, and cobalt remained an export-quota story.
SMM's battery-grade lithium carbonate average fell to 90,650 yuan/t on Nov 12, 5.7% below the 96,100 yuan/t of Oct 29, while SMM-tracked inventory kept falling to 122,644 t. LME nickel rose above $16,000/t on signals that Indonesia will cut 2027 ore quotas.
6.1 Battery metals at a glance
Lithium prices are yuan per tonne: SMM spot is an industry data provider's daily average of battery-grade carbonate; GFEX LC2701 is the most-traded futures contract (daily close, not settlement, unless stated).
| Item | Key figure | Date | Status | Source |
|---|---|---|---|---|
| SMM lithium carbonate spot average | 93,800 yuan/t | Nov 3 | Reported | SMM |
| SMM spot average (weekly Thursday) | 91,700 yuan/t, -4.6% from 96,100 a week earlier | Nov 5 | Reported | SMM |
| SMM spot average | 93,600 (Nov 6); 92,500 (Nov 9) | Nov 6; Nov 9 | Reported | SMM |
| SMM spot average | 90,650 yuan/t, -3.2% vs previous Friday | Nov 12 | Reported | SMM |
| GFEX LC2701 close | 89,300 (Nov 3); 92,860 (Nov 6) | Nov 3; Nov 6 | Reported | SMM |
| GFEX LC2701 close | 87,480, -4.85% on the prior settlement | Nov 9 | Reported | SMM |
| China lithium carbonate inventory | 125,391 t (Nov 5); 122,644 t, -2,747 t (Nov 12) | Nov 5; Nov 12 | Reported | SMM |
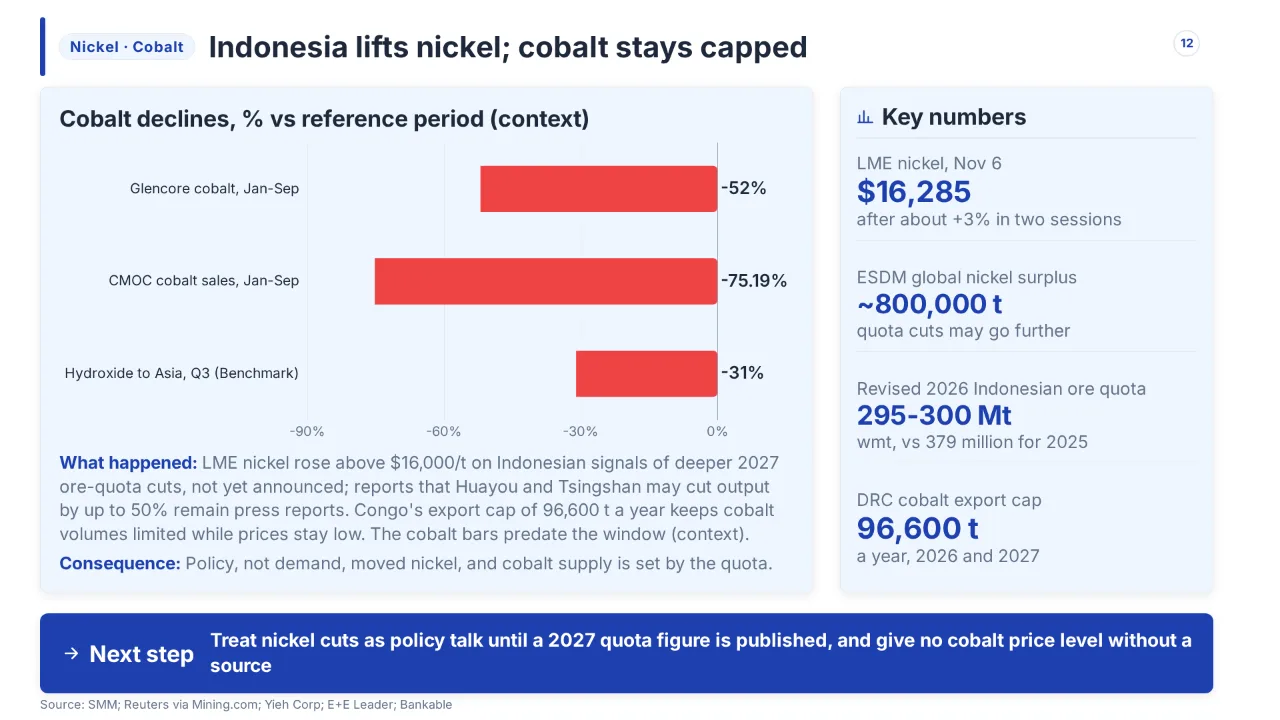
| LME nickel | $16,285/t after about +3% in two sessions | Nov 6 | Reported | Reuters via Mining.com |
| LME nickel | above $16,000/t, six-week high | Early Nov | Reported | Yieh Corp |
| Indonesia revised 2026 ore quota | 295-300 million wmt | Nov 4 | Reported | SMM |
| DRC cobalt export cap | 96,600 t a year, 2026 and 2027 | In effect | Official framework | E+E Leader |
6.2 Lithium: a V-shaped week inside a lower range
SMM's weekly reviews describe a market in which spot prices rose and fell within a narrow band while supply expanded. The spot average slipped from 96,100 yuan/t on Oct 29 (context) to 91,700 on Nov 5, rebounded to 93,600 on Nov 6, and ended at 90,650 on Nov 12, so the window change from Nov 3 is (90,650 - 93,800) / 93,800 = -3.4%, and from the Oct 29 base -5.7%. Futures were choppier: LC2701 closed at 89,300 on Nov 3, 91,580 on Nov 5 (+3.64% on the week), 92,860 on Nov 6, then dropped 4.85% to 87,480 on Nov 9 before recovering. A market analyst's post put GFEX at about 90,580 on Nov 13, a figure we treat as indicative because it is a social-media post (analyst post, not exchange data).
SMM's explanation is supply growth meeting cautious buyers: weekly output was 28,079 t, down 121 t, "the first decline after several consecutive weeks of growth" as some spodumene-based plants halted lines, while lepidolite output rose after major mines resumed; downstream purchases were "mainly driven by rigid demand" and precursor schedules for November fell notably. Inventory fell from 125,391 t to 122,644 t over the week to Nov 12, which SMM sees as support if low prices trigger restocking; it expects a next-week range of 85,000-105,000 yuan/t (industry estimate). Looking out, Citi (Nov 12, as reported) cut its 2027 lithium price forecast by 38% to US$1,250/t, expects the market to move from a 59,000 t deficit to a 47,000 t surplus, and cut targets on Australian miners by 27-29% (analyst estimate). Chile's Cochilco forecasts output of 325,000 t in 2026 and 335,000 t in 2027 (agency estimate). Albemarle's third-quarter results, covered on Nov 10, showed realised lithium prices per kilogram of carbonate equivalent nearly doubling year on year, with volume down about a fifth, a reminder that producer earnings lag spot prices. Upcoming: GFEX launches lithium hydroxide futures on Nov 26 and options on Nov 27 (SMM headline).
6.3 Nickel and cobalt: policy-driven
Nickel. SMM reported on Nov 4 that Indonesia's energy ministry (ESDM) indicated 2027 ore quota cuts "may be more aggressive" than 2026's; the director of mineral business development, Cecep Mochammad Yasin, said quotas would reflect smelters' optimal capacity and cited a global surplus of about 800,000 t, while Huayou and Tsingshan are "reportedly" considering cuts of up to 50% (press report, not a company statement). Another official, Septian Hario Seto, backed using the annual work plans to cut output (Nov 3 convention); the revised 2026 quota is 295-300 million wet tonnes against an initial 260-270 million and 379 million for 2025. No 2027 number has been announced. LME nickel rose above $16,000/t, a six-week high, and was $16,285 on Nov 6 after jumping about 3% in two sessions. We do not compute a window change because the material has no matching Oct 30 or Nov 13 nickel close.
Cobalt. The structural fact is unchanged: the DRC capped cobalt exports at 96,600 t a year for 2026 and 2027 (87,000 t base plus a 9,600 t strategic allocation), with a 10% royalty prepaid. Company numbers published just before the window show the effect (context): Glencore's own-sourced cobalt fell 52% to 13,700 t in January-September, and CMOC's cobalt sales fell 75.19% to 12,661 t against production of 99,694 t. Benchmark said cobalt hydroxide delivered to Asia fell 31% in the third quarter to $17.25/lb. In the window, SMM's Nov 14 weekly-review headline says cobalt products "rebound from year-to-date lows" and refined cobalt rose 40,000 in a week (units are not shown in the headline, and we have no article text). We therefore give no cobalt price level for the window.
7. Macro drivers and demand
The price moves in Chapters 2-6 share three macro causes: the US midterm result, a hotter-than-expected inflation and jobs run that put a December Fed hike in the price, and a Chinese import picture that was strong in value but uneven in volume.
A 0.4% October CPI and 165,000 new jobs turned the Fed's December meeting into a hike question. The two-year Treasury yield rose about 35 basis points on the week, the 10-year returned above 5%, and the Bloomberg Commodity Total Return Index logged a fourth weekly decline.
7.1 Macro at a glance
| Item | Key figure | Date | Status | Source |
|---|---|---|---|---|
| US midterm elections | Democrats win the House and Senate; Trump says the Iran war played a role | Nov 3-4 | Reported | Reuters |
| Market reaction | S&P 500 +1.6%, Nasdaq +1.4%; US dollar index -0.3% to 101.52; 10-year yield 4.9% | Nov 4 | Reported | Morningstar |
| US payrolls (October) | +165,000 vs 59,000 expected (Dow Jones); unemployment 4.1% vs 4.2% expected | Nov 6 | Reported | MLQ.ai, citing BLS and CNBC |
| US CPI (October) | +0.4% m/m vs 0.3% expected; core +0.3% vs 0.2%; no annual rate published | Nov 10 | Reported (BLS) | CNBC |
| Two-year Treasury yield | +17.6 bp on the day; 10-year back above 5% | Nov 10 | Reported | Consolidated Wealth |
| 10-year / 2-year Treasury yield | 5.123% / 4.859% | Nov 13 | Reported | CNBC |
| US dollar index (DXY) | 103.08 intraday high, strongest since April 2025 | Nov 12 | Reported | Consolidated Wealth |
| Bloomberg Commodity TR index | Fourth weekly decline, three-month low, +26% year to date | Week to Nov 13 | Analyst view | Saxo (Ole Hansen) |
| China imports (October) | +41.6% y/y to $307.05 bn vs 32% expected | Nov 7-9 | Reported | Trading Economics |
7.2 Politics and the dollar: why oil, gold and copper all moved on Nov 4
The midterm result was the one event that moved every market in this report on the same day. Reuters reported that Republicans lost both chambers; Morningstar recorded that Treasuries rallied, the dollar index fell to 101.52, its lowest in over a month, oil and defence stocks weakened on expectations of more scrutiny of the Iran war, and gold rose 3.4% to $4,074.90 (a different intraday reading from the $4,061.30 in Chapter 4). Deutsche Bank's Jim Reid said a divided government "has generally made it harder for fiscal stimulus to be passed", and investors priced about 50 bp of Fed rises to 2027, fewer than before the election (analyst views). The same result hit copper through the AI channel: Goldman Sachs expected Democratic governors in Texas, Georgia and Michigan to impose conditional moratoria on data centres, and AI-linked shares fell (Nvidia and Intel more than 3%). Upcoming: US spending authority expires on Dec 11, and Goldman expects a short extension to February or March.
7.3 Inflation, jobs and the Fed
The jobs report of Nov 6 reversed a softening in hike expectations. Payrolls rose 165,000 in October with 84,000 of upward revisions to August and September, and unemployment fell to 4.1%. The consensus is quoted at 59,000 by Dow Jones and 75,000 by ING; either way the beat was large, and we follow the Dow Jones figure that MLQ.ai and CNBC cite. ING said hike expectations had been "close to a 50:50 call at one point" before the report and that about 20 bp was then priced for the December meeting, and it expects a December hike without further hikes in 2027 (analyst estimate).
October CPI on Nov 10 made the case. Headline rose 0.4% (September 0.6%), core 0.3% for the third month; gasoline rose 1% after +9.1% in September, and airfares rose 0.4%. BLS published no annual rates because of the October 2025 data gap. Consolidated Wealth, a wealth manager, calculated the three-month annualised core rate at 3.7%, the fastest since April 2024 (derived by that firm, not BLS), and said the breadth of the rise beyond energy suggests the oil shock is feeding wider prices. The two-year yield closed 17.6 bp higher on Nov 10 and the 10-year went above 5%, ending the week near 5.12%. The dollar index hit 103.08 intraday on Nov 12; that firm warns the euro is about 58% of the index, so part of the rise is euro weakness. Fed Governor Waller and Dallas Fed President Logan both leaned hawkish (Chapter 4). The Fed raised rates to 3.75-4.00% on Sep 16 and held on Oct 28 (context). For commodities the transmission is the one stated in Chapter 4: higher yields and a stronger dollar cut gold and silver, while the same oil-driven inflation is why a falling oil price matters to the Fed (analyst view).
7.4 China and the commodity index
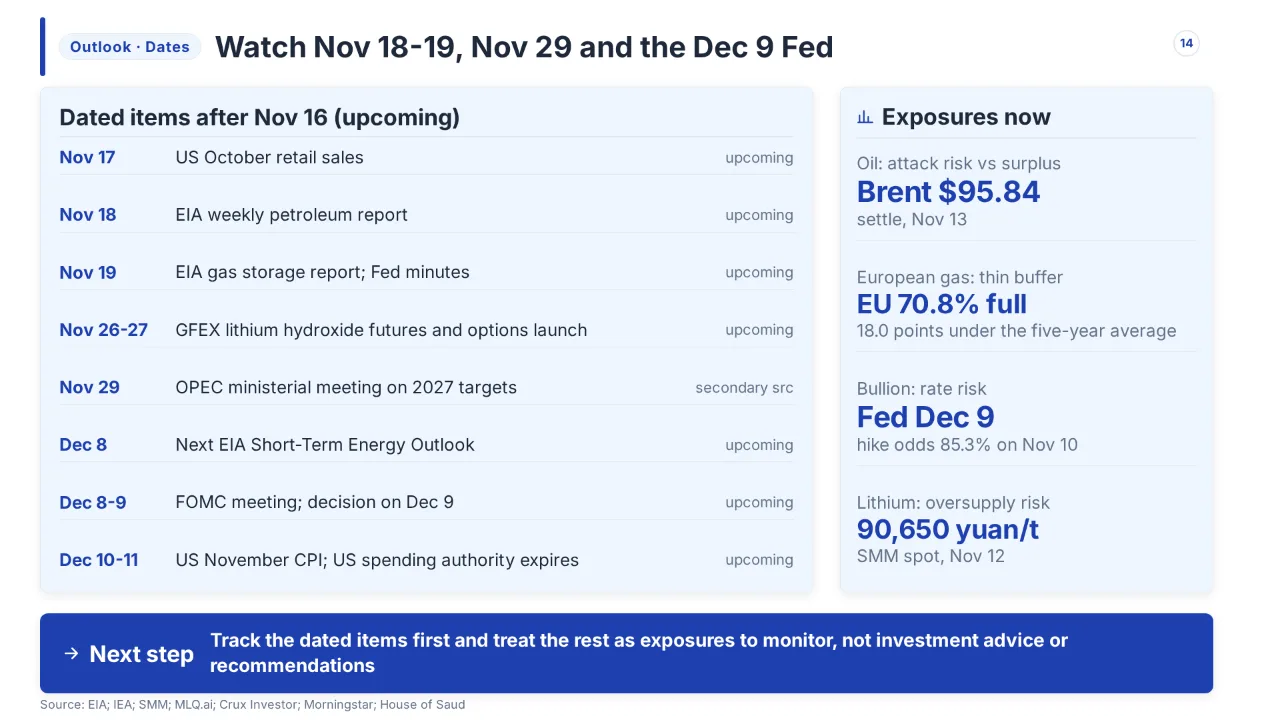
China's October imports rose 41.6% year on year to $307.05 billion, against 32% expected and 31.0% in September; high-tech imports rose 50.8%, imports of copper ore and concentrates 28.4% and of unwrought copper and products 31.1% (values in dollars, which include price effects), and crude oil 4.5%. Volumes tell a more cautious story: copper concentrate imports fell 11% (Chapter 5), and customs shows iron ore up only 3.1% for January-October. The Bloomberg Commodity Total Return Index fell for a fourth straight week to a three-month low and trimmed its year-to-date gain to 26%, with every sector except grains lower; precious metals fell about 4% on the dollar and a 35 bp jump in the two-year yield (Saxo analyst view). This contrasts with the previous issue's end-October reading of an index that was roughly flat for October. Upcoming: October PPI on Nov 13 (value not in the material), retail sales on Nov 17, Fed minutes on Nov 19, the Fed decision on Dec 9 and November CPI on Dec 10.
8. Supply and demand risks and what to watch
Chapters 2-7 followed each commodity and the macro backdrop; this chapter pulls out the risks still open on Nov 17 and the dates that will settle them. It adds no new facts, and what follows describes exposure, not investment advice.
8.1 Risks by commodity
Oil. The price now rests on diplomacy against disruption. Supply is recovering (IEA: October supply 105.4 mb/d, stocks +52 mb), US crude stocks rose 4.7 mn bbl on Nov 12, and Brent has fallen about 8.5% since Nov 2. The upside risks are attacks: 37 ships were attacked near Hormuz in October and 10 more in early November, Houthi claims against Saudi sites and Iranian claims of tanker hits remain unverified, and Trump said a deal is not needed and the blockade stays. The EIA's STEO (forecast completed Nov 5) still expects Brent near $100 for the rest of 2026, so the market is trading below an agency estimate that predates the sell-off. For OPEC+, the open question is 2027 targets (Nov 29, secondary source).
Gas. Two opposite risks. In the US, Henry Hub is supported by record LNG feedgas above 20 Bcf/d but capped by a storage surplus of 2.0% over the five-year average, and a record speculative short makes rallies sharp. In Europe, EU storage was 70.8% on Nov 13, 18.0 points under the five-year average, the lowest entry to winter since 2013 according to the IEA, with withdrawals running early. A Hormuz reopening would lower prices but would not refill storage quickly.
Gold and silver. The demand risk is rates, not the war. A December hike is the baseline, the 25 bp versus 50 bp split is the variable (FedWatch 85.3% versus 14.7% on Nov 10), and a Reuters poll shows all 101 economists expecting 25 bp. Central banks (321 t in Q3) are the structural support, while Goldman cut its year-end 2026 target to $4,150 (estimate).
Copper and industrial metals. Financial and physical markets disagree: funds cut COMEX copper longs to 34,444 contracts, LME stocks reached 328,600 t, and the US tariff premium collapsed to about $80/t, while SHFE stocks sat at 33,848 t and China's spot premium touched a record 2,615 yuan/t before falling to 275 yuan/t on Nov 13. A proposed US refined-copper tariff of 15% from 2027 (30% from 2028) remains undecided (context, Oct 22 report). Aluminium stocks are the lowest of the year and iron ore is weak on steel demand.
Lithium, nickel and cobalt. SMM expects lithium to consolidate at lows within 85,000-105,000 yuan/t, with output slowing and inventory falling; Citi expects a 2027 surplus (estimate). Indonesian 2027 nickel quotas are the swing factor and no figure is announced. Congo's cobalt quota of 96,600 t a year keeps volumes capped while prices stay depressed.
8.2 What changed and what it means by reader
| Reader | What changed | Implication (description, not advice) | Source |
|---|---|---|---|
| Oil consumers and refiners | Brent $95.84 on Nov 13, down 8.5% from Nov 2; supply above demand in October | Crude cost eased, but diesel stays tight (IEA) and attack headlines can add $3 in a day | — |
| Oil producers | OPEC+ held December targets; OPEC and Saudi output near prewar | Volume is returning faster than prices are rising; 2027 targets are the next decision | — |
| European gas buyers | EU storage 70.8%; TTF $28.0 on Nov 6 | Lower price but a thin buffer, so cold weather is the main risk | — |
| US gas producers | Henry Hub Dec $3.337 on Nov 12, +11.3% from Nov 6; LNG feedgas record | Export demand sets a floor while storage caps rallies (TradingNEWS view) | — |
| Gold and silver holders | Spot gold $4,147 on Nov 5, $3,883 on Nov 13; hike odds above 85% | Prices follow yields and the dollar; the round trip left COMEX gold flat against Oct 30 | — |
| Copper buyers and miners | LME 3M $13,780 on Nov 6, LME stocks +20% in three weeks; China premium record then 275 yuan/t | Screen price and physical tightness diverged; the divergence narrowed by Nov 13 | — |
| Lithium and battery makers | SMM spot 90,650 yuan/t, -5.7% from Oct 29; inventory 122,644 t | Low prices are drawing down stocks but demand is need-based | — |
| Nickel and cobalt producers | LME nickel above $16,000; Indonesia signals 2027 cuts | Policy, not demand, moved nickel; cobalt volumes stay quota-bound | — |
| Index investors | BCOM total return down four weeks, +26% year to date | Metals and oil led the decline (Saxo view); only grains rose | — |
8.3 Key dates
State is judged against Nov 17, 2026. Dates marked "not stated" are not given in Chapters 2-7.
| Date | Event | State on Nov 17, 2026 | Source |
|---|---|---|---|
| Nov 3 | IEA Global Gas Security Review and Q4 gas analysis | Published | IEA |
| Nov 3-4 | US midterms; Democrats take both chambers | Reported | Reuters |
| Nov 6 | US October jobs report: +165,000 | Reported | MLQ.ai |
| Nov 10 | US October CPI +0.4%; EIA STEO released | Reported | CNBC; EIA |
| Nov 13 | IEA Oil Market Report; US October PPI | OMR published; PPI value not in the material | OGJ; Crux Investor |
| Nov 17 | US October retail sales | Upcoming | SMM |
| Nov 18 | EIA weekly petroleum report (normally Wednesdays) | Upcoming | FinanceFeeds |
| Nov 19 | EIA gas storage report (week to Nov 13); Fed October minutes | Upcoming | TradingNEWS; SMM |
| Nov 26-27 | GFEX lithium hydroxide futures and options launch | Upcoming | SMM |
| Nov 29 | OPEC ministerial meeting on 2027 targets | Upcoming (secondary source) | House of Saud |
| Dec 8 | Next EIA Short-Term Energy Outlook | Upcoming | EIA |
| Dec 8-9 | FOMC meeting; decision on Dec 9 | Upcoming | MLQ.ai; Crux Investor |
| Dec 10 | US November CPI, a day after the Fed decision | Upcoming | Crux Investor |
| Dec 11 | US spending authority expires | Upcoming | Morningstar |
| Not stated | Indonesia 2027 nickel ore quota announcement | Upcoming | SMM |
9. References
This document draws on the following 77 sources, listed in the order they are first cited.
- The Oil Market Response to Middle East Developments - Sprague Energy — spragueenergy.com
- Oil slumps after midterm election rebuke to Trump raises bets on Iran war exit | Reuters — reuters.com
- Brent’s Climb to $92.53 on Hormuz Attacks Pauses Oil Producers’ Price Slide - Article | Crux Investor — cruxinvestor.com
- Brent Crude $95.84: Week Ahead After a 2nd Weekly Loss — financefeeds.com
- IEA releases Oil Market Report for November 2026 - Tank Storage Magazine — tankstorage.com
- IEA sees oil market surplus returning as Gulf exports recover | Oil & Gas Journal — ogj.com
- December Natural Gas Slips to $3.23 as Storage Surplus Widens, but 20 Bcf/d LNG Keeps $3.40 in Play — tradingnews.com
- Natural gas prices weekly update – JKM, TTF and Henry Hub (9 November 2026) | Global LNG Hub — globallnghub.com
- EU Gas Storage Levels Today: % Full vs Last Year | Voltstack — voltstack.energy
- Low storage buffers in Europe could prolong global gas market tightness well into 2027 - IEA — iea.org
- Gold Prices Surge as Democrats Sweep U.S. Midterm Elections, Reclaiming $4,100 an Ounce — BigGo Finance — finance.biggo.com
- Rick Rule and Jeff Phillips on a Falling Resource Market — canadianminingreport.com
- Gold drops toward $4,050 as US CPI fuels speculation of larger Fed rate hike — fxstreet.com
- Goldman Sachs Lowers Gold Price Targets, Citing Hawkish Federal Reserve as Key Variable — BigGo Finance — finance.biggo.com
- Central bank buying and ETF inflows support gold demand in Q3 | World Gold Council — gold.org
- Copper Price This Week: Down 3.8% as Gold Rose 4.5% (Nov 6) | StakeMyGold — stakemygold.com
- Copper price falls, heads for worst week since March on AI rout - MINING.COM — mining.com
- Shanghai spot copper premiums surge to 2615 yuan/mt, the highest level in history. How tight is supply before delivery? - Shanghai Metals Market (SMM) — news.metal.com
- Back spread widened significantly before delivery, with suppliers selling intensively, pushing spot premiums further down SMM SHFE Copper Spot - Shanghai Metals Market (SMM) — news.metal.com
- westmetall . market data . prices/lme stocks . copper, tin, lead, zinc, aluminium, nickel, gold, fine silver — westmetall.com
- Latest Analysis about China Steel & Commodities Market | Mysteel — mysteel.net
- "Lithium Carbonate Prices Rebound After Dip; Inventory Continues to Decline" - Shanghai Metals Market (SMM) — news.metal.com
- LME nickel & NPI prices rebound on Indonesian ore quota restriction plans-Yieh Corp Steel News — yieh.com
- SMM Nickel Flash News Indonesia Signals More Aggressive Nickel Ore RKAB Cuts for 2027 - Shanghai Metals Market (SMM) — news.metal.com
- U.S. adds 165,000 jobs in October, nearly three times forecasts, as December Fed hike odds climb | MLQ.ai — mlq.ai
- Here's the inflation breakdown for October 2026 — in one chart — cnbc.com
- December hike: Hot US inflation sends yields surging to 5% — consolidatedwealth.co.za
- Ole S Hansen on X: "#Commodities: The Bloomberg Commodity Total Return Index is heading for a fourth consecutive, albeit modest, weekly decline, slipping to a three-month low and reducing its year-to-date gain to 26%. All sectors except grains trades lower, led by metals, with precious metals down… / X — x.com
- China Imports Climb Above Forecasts — tradingeconomics.com
- China's copper concentrate imports slump 11% in October as smelter woes deepen - MINING.COM — mining.com
- Crude Oil Market Analysis – Softer Futures Curve and Q4 Surplus Risks — CMB News — commodity-board.com
- Gold edges lower as focus shifts to US inflation data | Reuters — reuters.com
- SMM Lithium Carbonate Daily Review On November 3, spot lithium carbonate edged up and held steady, while futures retreated after a rapid rise, closing lower on reduced positions. - Shanghai Metals Market (SMM) — news.metal.com
- Oil prices set for second weekly decline as Trump to stay with Iran blockade - The Business Times — businesstimes.com.sg
- Oil rises on Iran war uncertainty after Trump's Republicans vote rout — cnbc.com
- Brent Crude Oil Falls 21%, Outpacing WTI, as Peace Hopes Build — vantagemarkets.co.uk
- Brent Crude Oil Price Today: $95.84 (15 Nov 2026) | GOS — globaloilshock.com
- Short-Term Energy Outlook - U.S. Energy Information Administration (EIA) — eia.gov
- OPEC holds oil demand forecast, flags Saudi output at pre-war level — qcintel.com
- Ajay Bagga on X: "The 2027 oil demand acceleration OPEC Monthly Oil Market Report, November 2026: OPEC's oil demand outlook contains an important signal. Global oil demand growth is forecast at just 0.2 million barrels per day in 2026. For 2027, OPEC expects growth to accelerate dramatically to… / X — x.com
- OPEC+ maintains crude oil production targets for December 2026 | Enerdata — enerdata.net
- Saudi Arabia Pumps 9.2 Million Bpd, OPEC at 90% — houseofsaud.com
- OPEC leaves 2026, 2027 oil demand growth forecasts unchanged — scanx.trade
- Asian spot LNG prices ease but stay near four-year high — pgjonline.com
- Week Ahead: Fed Minutes, US Retail Sales And Iran Headlines Test Gold At 3,880 As Copper Breaks Its Channel | Technical Analysis - Commodity Report | 14 Nov 2026 - Capital Street FX — capitalstreetfx.com
- Natural Gas Storage Build Misses Estimates, but Surplus Widens — naturalgasintel.com
- EIA raises November natural gas storage forecast after warm start to month — eia.gov
- European gas demand surges as storage withdrawals accelerate | European Gas Hub — europeangashub.com
- Europe gas storage levels : weekly fullness rate tracker and analysis – EnergyScan — energyscan.engie.com
- Low Storage Buffers In Europe Could Prolong Gas Market Tightness Into 2027: IEA — rttnews.com
- Record 3% LNG Contraction Hands Winter Pricing Power to Flexible Cargoes - Article | Crux Investor — cruxinvestor.com
- Hot US Inflation Pulls Gold Lower as Fed Hike Bets Test Miners - Article | Crux Investor — cruxinvestor.com
- Platinum Backwardation, Palladium Short | Heavy Metal Stats — heavymetalstats.com
- Gold Price Climbs Above US$4,000 After Democrat Midterm Win | INN — investingnews.com
- Gold Near $4,000 After Hot CPI, Fed Tightens — briefs.co
- Goldman Sachs sharply cuts its gold price target! Central bank gold purchases cannot offset the Federal Reserve's hawkish shift; the current landscape closely resembles that of 2022. — news.futunn.com
- US inflation exceeding expectations pressures copper prices; SHFE copper spot premiums are expected to rebound after contract rollover SMM Macro Weekly Review - Shanghai Metals Market (SMM) — news.metal.com
- Aluminium Price Today: Price, Trends & Forecast 2026 | Tacto — tacto.ai
- CPI Pressures Gold - ADM Investor Services — admis.com
- AI Selloff Cut Copper’s US Premium, Favoring LME-Priced Producers - Article | Crux Investor — cruxinvestor.com
- Copper Price Today: Price, Trends & Forecast 2026 | Tacto — tacto.ai
- General Administration of Customs: In the first 10 months, copper semis imports fell 5.5%, rare earth imports fell 0.7%, and aluminum semis exports rose 17.8% - Shanghai Metals Market (SMM) — news.metal.com
- Mysteel on X: "Imported iron ore inventories at China's 47 major ports rose 1.4% week-on-week to 175.3 million tonnes as of November 5—the highest since late June. 𝙏𝙝𝙚 𝙛𝙪𝙡𝙡 𝙫𝙚𝙧𝙨𝙞𝙤𝙣 𝙞𝙨 𝙖𝙫𝙖𝙞𝙡𝙖𝙗𝙡𝙚 𝙞𝙣 𝙩𝙝𝙚 𝙘𝙤𝙢𝙢𝙚𝙣𝙩𝙨. #IronOre #China #Commodities" / X — x.com
- (6) China's Major Imports by Quantity and Value, Oct 2026 (in USD) — english.customs.gov.cn
- China's Steel Exports Decline in October - 2026-11-11 | ScrapMonster — scrapmonster.com
- SMM Analysis Market Sentiment Marginally Recovers, Lithium Carbonate Destocking Accelerates - Shanghai Metals Market (SMM) — news.metal.com
- SMM Lithium Carbonate Daily Review On November 6, spot lithium carbonate continued to rise, while futures opened lower, moved higher, and closed up on reduced open interest. - Shanghai Metals Market (SMM) — news.metal.com
- SMM Lithium Carbonate Daily Review On November 9, spot lithium carbonate stopped rising and pulled back, while futures opened lower, drifted lower with increased open interest, and closed lower. - Shanghai Metals Market (SMM) — news.metal.com
- SMM Cobalt-Lithium Morning Meeting Summary Industry chain prices consolidate, differentiated demand under pressure, energy storage market continues to improve - Shanghai Metals Market (SMM) — news.metal.com
- Indonesia Nickel, Congo Cobalt Quotas Reset Battery Supply | E+E Leader — environmentenergyleader.com
- Carl Capolingua on X: "#Lithium Minerals Update 6-Nov 🔋 >Carbonate 99.5% RMB/t GFEX Futures 92.86k +1.4% 👍 SMM Spot 93.6k +2.1% 👍 >Spodumene US$/t SMM Conc. Index 1240 0% SMM Aus Spot Conc. 1288 0% >Hydroxide 56.5% RMB/t SMM Spot 84.25k +2.1% 👍 $MIN $PLS $LTR $ELV $ALB $LAC $LIT $SQM" / X — x.com
- Citi cuts lithium miner targets as market heads for surplus | NYSE:C — proactiveinvestors.com
- Albemarle (NYSE:ALB) Quarterly Results: Lithium Pricing Lifts Earnings and Capital Spending Falls — kalkine.com
- CMOC Cobalt Sales Plunge 75% Amid DR Congo Export Quota Disruptions - BANKABLE — bankable.africa
- US Midterms: How Markets Are Reacting to Democrats’ Congressional Gains | Morningstar — morningstar.com
- Treasury yields rise as traders strengthen Fed rate hike bets — cnbc.com
- Robust US jobs market boosts December rate hike chances | ING THINK — think.ing.com