
跳到正文

[PPT] 大宗商品 · 覆盖 2026-10-24 至 2026-11-0215 页 · English

Commodities Biweekly Brief · Oct 24–Nov 2, 2026

Generated with Divrite · 完成于 2026年11月2日

订阅「大宗商品」 · 免费 · 不用注册 · 随时退订

原始提问
Write the "Commodities" hot-topic report covering 2026-10-24 to 2026-11-02. Unit of coverage: the commodity — prices, inventories and supply-demand events for crude oil, natural gas, gold, copper, lithium and other major commodities, explaining why prices moved. Sections: 1. Key points of the two weeks 2. Energy 3. Precious metals 4. Industrial metals 5. Battery metals 6. Supply and demand risks. Length: 10–12 slides. Key sources: exchange prices, EIA and IEA, OPEC, inventory data, industry research. Cite every key number; leave out anything without a reliable source. Answer in English.

这份作品是英文的。点「做一份同款」,用中文提问,Divrite 会用中文重新研究并写成。

全部 15 页

  1. 第 1 页:Commodities Biweekly Brief|Oct 24–Nov 2, 2026

    第 1 页

    Commodities Biweekly Brief|Oct 24–Nov 2, 2026

    讲稿

    Welcome to the Divrite Research commodities biweekly brief for October 24 to November 2, 2026. It covers prices and supply and demand drivers in oil, gas, precious metals, industrial metals and battery metals, with every fact judged against November 3. First, the contents.

    页面文字

    Commodities Biweekly Brief

    Divrite Research · Hot Topics

    Issue for Oct 24–Nov 2, 2026

    PUBLISHED BY

    Divrite Research

    FACTS JUDGED AGAINST

    Nov 3, 2026

  2. 第 2 页:Contents

    第 2 页

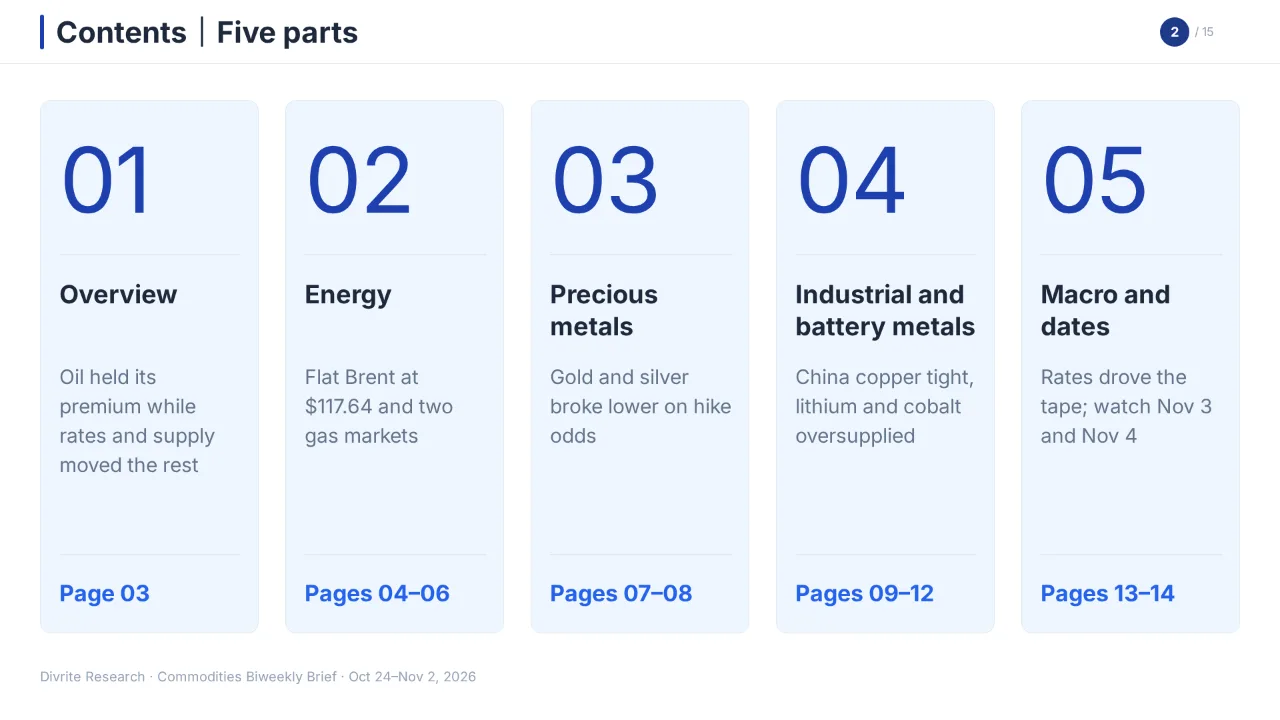
    Contents

    讲稿

    This brief has five parts: an overview, energy, precious metals, industrial and battery metals, and macro and dates. We start with the overview, which says to read rates and oil first, then metal supply.

    页面文字

    Contents|Five parts

    / 15

    Overview

    Oil held its premium while rates and supply moved the rest

    Page 03

    Energy

    Flat Brent at $117.64 and two gas markets

    Pages 04–06

    Precious metals

    Gold and silver broke lower on hike odds

    Pages 07–08

    Industrial and battery metals

    China copper tight, lithium and cobalt oversupplied

    Pages 09–12

    Macro and dates

    Rates drove the tape; watch Nov 3 and Nov 4

    Pages 13–14

    Divrite Research · Commodities Biweekly Brief · Oct 24–Nov 2, 2026

  3. 第 3 页:Overview|Read rates and oil first, then metal supply

    第 3 页

    Overview|Read rates and oil first, then metal supply

    讲稿

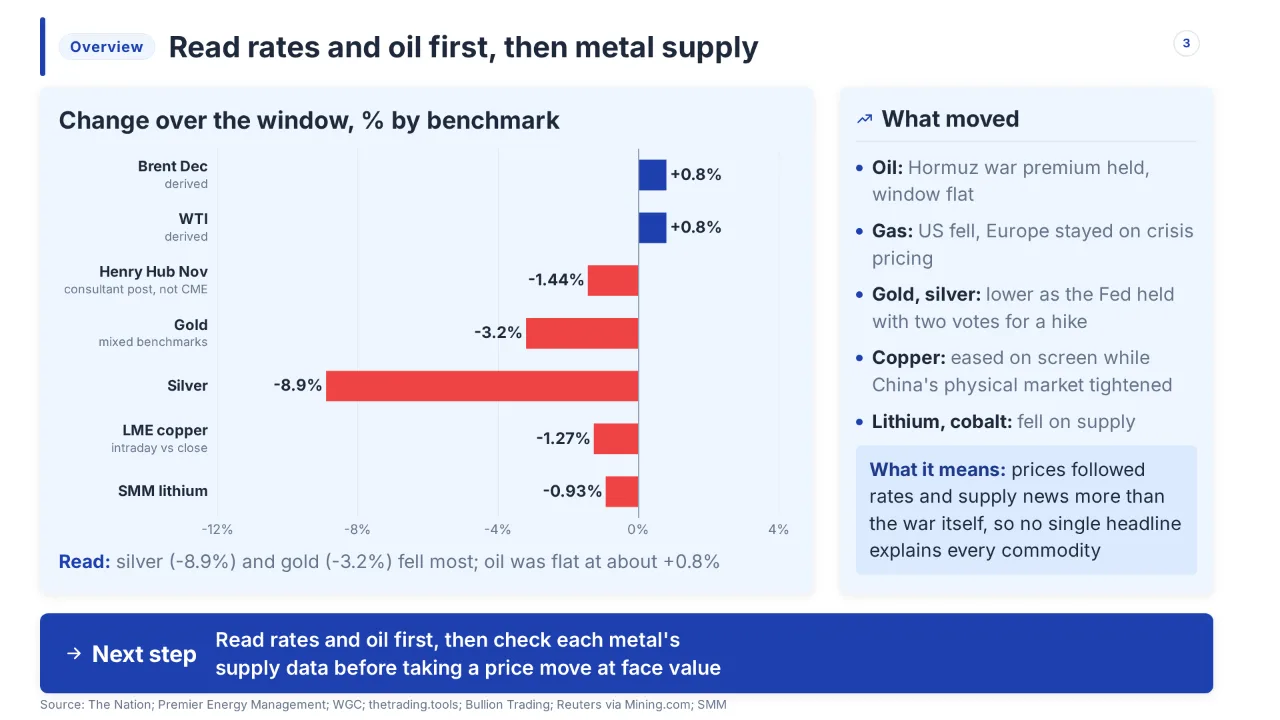
    The overview says to read rates and oil first, then check each metal's supply data. Oil held its Hormuz war premium, with Brent December at $117.64 on Oct 30, about +0.8% over the window. Silver fell 8.9% to $49.12, and gold fell about 3.2% on mixed benchmarks, as the Fed held with two votes for a hike. LME copper eased 1.27%, and SMM lithium carbonate fell 0.93% to 96,100 yuan a tonne. Prices followed rates and supply news more than the war itself. Next, oil prices in detail.

    页面文字

    Overview

    Read rates and oil first, then metal supply

    Source: The Nation; Premier Energy Management; WGC; thetrading.tools; Bullion Trading; Reuters via Mining.com; SMM

    Change over the window, % by benchmark

    Read: silver (-8.9%) and gold (-3.2%) fell most; oil was flat at about +0.8%

    What moved

    Oil: Hormuz war premium held, window flat

    Gas: US fell, Europe stayed on crisis pricing

    Gold, silver: lower as the Fed held with two votes for a hike

    Copper: eased on screen while China's physical market tightened

    Lithium, cobalt: fell on supply

    What it means: prices followed rates and supply news more than the war itself, so no single headline explains every commodity

    Next step

    Read rates and oil first, then check each metal's supply data before taking a price move at face value

    数据出处
    【本页依据】 ① Brent Dec settled at $117.64 on Oct 30, about +0.8% vs a derived Oct 23 base —— Brent ends October up 13.6% as Iran war risks unsettle markets · nationthailand.com · https://www.nationthailand.com/news/world/40072956;Oil Prices Fall After Weekend Rally, Diplomacy and Security Tensions Loom | CORNERSTONE FUTURES LLC posted on the topic | LinkedIn · linkedin.com · https://www.linkedin.com/posts/cornerstone-futures-llc_oilmarkets-bren… prices set for sharp monthly rise on Hormuz strikes and US threat to hit Iran | The National · thenationalnews.com · https://www.thenationalnews.com/business/markets/2026/10/30/oil-prices… ② Henry Hub November settled at $2.602 on Oct 26, -1.44% (consultant post, not CME) —— Natural Gas Prices Fall 5.6% to 2.64/MMBtu | Premier Energy Management LLC posted on the topic | LinkedIn · linkedin.com · https://www.linkedin.com/posts/premier-energy-management-llc_naturalga… ③ Gold COMEX $3,885, about -3.2% vs LBMA PM $4,013.3 (mixed benchmarks) —— Gold Price Today and Since 1960, With Every 20% Decline | thetrading.tools · thetrading.tools · https://www.thetrading.tools/gold-price;Weekly Markets Monitor · gold.org · https://www.gold.org/download/file/21299/WMM_26_Oct_2026_Chill_and_boo… ④ Silver closed at $49.12, -8.9% vs $53.9 on Oct 23 —— Gold and silver slid to fresh lows (Oct 30, 2026) · bulliontradingllc.com · https://bulliontradingllc.com/news/2026-10-30;Weekly Markets Monitor · gold.org · https://www.gold.org/download/file/21299/WMM_26_Oct_2026_Chill_and_boo… ⑤ LME copper $14,140 on Oct 30, -1.27% vs the Oct 23 close (intraday vs close) —— Copper price set for first monthly loss since June as AI spending worries weigh - MINING.COM · mining.com · https://www.mining.com/web/copper-price-set-for-first-monthly-loss-sin… LME Weekly Review: 19-23 October 2026 · lmeinsight.com · https://www.lmeinsight.com/the-lme-weekly-review-19-23-october-2026 ⑥ SMM lithium carbonate averaged 96,100 yuan/t on Oct 29, -0.93% —— [SMM Analysis] Lithium carbonate prices plunge this week, destocking slows down - Shanghai Metals Market (SMM) · news.metal.com · https://news.metal.com/newscontent/104186365-smm-analysis-lithium-carb…
  4. 第 4 页:Oil · Prices|Brent ended flat at $117.64 after a 13.6% month

    第 4 页

    Oil · Prices|Brent ended flat at $117.64 after a 13.6% month

    讲稿

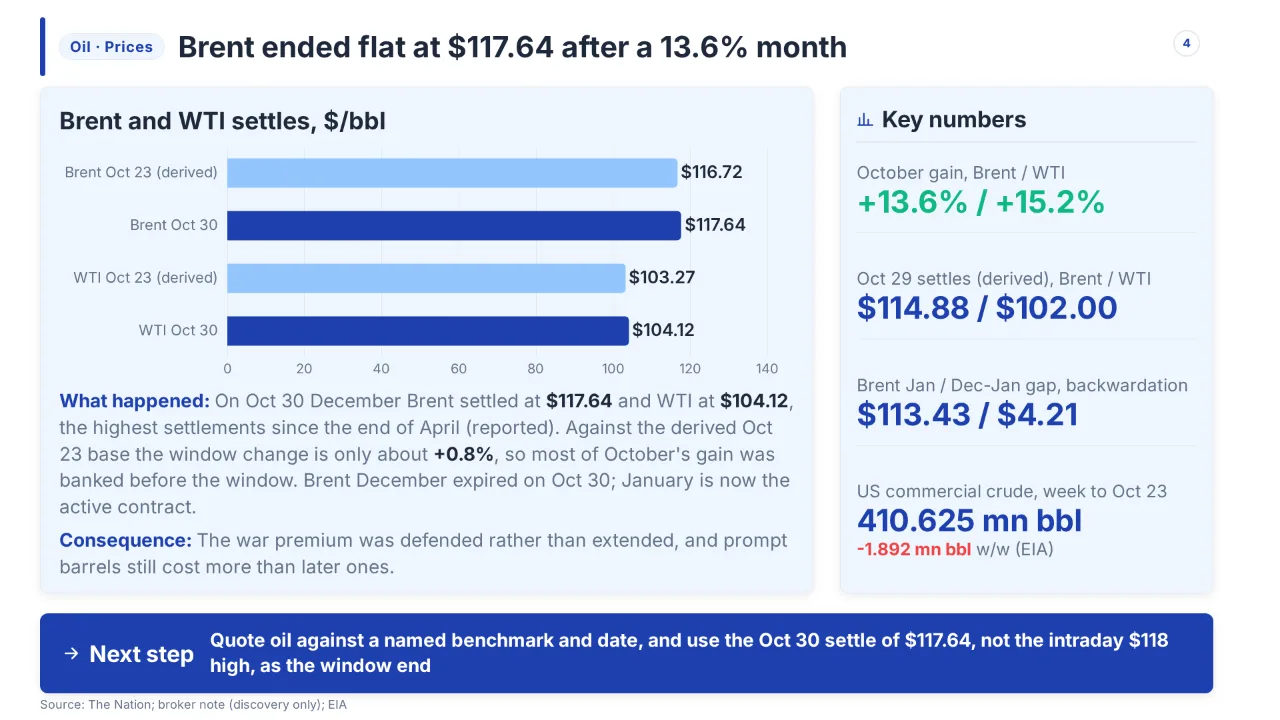
    Brent ended the window flat at $117.64 after a 13.6% October. On Oct 30, December Brent settled at $117.64 and WTI at $104.12, the highest settlements since the end of April, as The Nation reported. Against a derived Oct 23 base, the window change is only about +0.8%, so most of the gain came before the window. October gains were 13.6% for Brent and 15.2% for WTI. December Brent expired on Oct 30, and January, at $113.43, is now active, a $4.21 gap in backwardation. Quote oil against a named benchmark and date, and use the Oct 30 settle as the window end. Next, what sits behind the Hormuz premium.

    页面文字

    Oil · Prices

    Brent ended flat at $117.64 after a 13.6% month

    Source: The Nation; broker note (discovery only); EIA

    Brent and WTI settles, $/bbl

    What happened: On Oct 30 December Brent settled at $117.64 and WTI at $104.12 , the highest settlements since the end of April (reported). Against the derived Oct 23 base the window change is only about +0.8% , so most of October's gain was banked before the window. Brent December expired on Oct 30; January is now the active contract.

    Consequence: The war premium was defended rather than extended, and prompt barrels still cost more than later ones.

    Key numbers

    October gain, Brent / WTI

    +13.6% / +15.2%

    Oct 29 settles (derived), Brent / WTI

    $114.88 / $102.00

    Brent Jan / Dec-Jan gap, backwardation

    $113.43 / $4.21

    US commercial crude, week to Oct 23

    410.625 mn bbl

    -1.892 mn bbl w/w (EIA)

    Next step

    Quote oil against a named benchmark and date, and use the Oct 30 settle of $117.64, not the intraday $118 high, as the window end

    数据出处
    【本页依据】 ① On Oct 30 December Brent settled at $117.64 and WTI at $104.12, the highest settlements since the end of April —— Brent ends October up 13.6% as Iran war risks unsettle markets · nationthailand.com · https://www.nationthailand.com/news/world/40072956 ② Window change is about +0.8% against a derived Oct 23 base of $116.72 (Brent) and $103.27 (WTI) —— Oil Prices Fall After Weekend Rally, Diplomacy and Security Tensions Loom | CORNERSTONE FUTURES LLC posted on the topic | LinkedIn · linkedin.com · https://www.linkedin.com/posts/cornerstone-futures-llc_oilmarkets-bren… prices set for sharp monthly rise on Hormuz strikes and US threat to hit Iran | The National · thenationalnews.com · https://www.thenationalnews.com/business/markets/2026/10/30/oil-prices… ③ October gains were +13.6% for Brent and +15.2% for WTI —— Same as ① ④ Oct 29 settles were $114.88 (Brent) and $102.00 (WTI), derived —— Same as ① ⑤ Brent January settled at $113.43, a $4.21 Dec-Jan gap (backwardation) —— Same as ① ⑥ US commercial crude 410.625 mn bbl, -1.892 mn bbl in the week to Oct 23 —— Weekly Petroleum Status Report - U.S. Energy Information Administration (EIA) · eia.gov · https://www.eia.gov/petroleum/supply/weekly?monitor_asof=20261029_034240
  5. 第 5 页:Oil · Hormuz|Price Hormuz as risk: flow is 54% of prewar

    第 5 页

    Oil · Hormuz|Price Hormuz as risk: flow is 54% of prewar

    讲稿

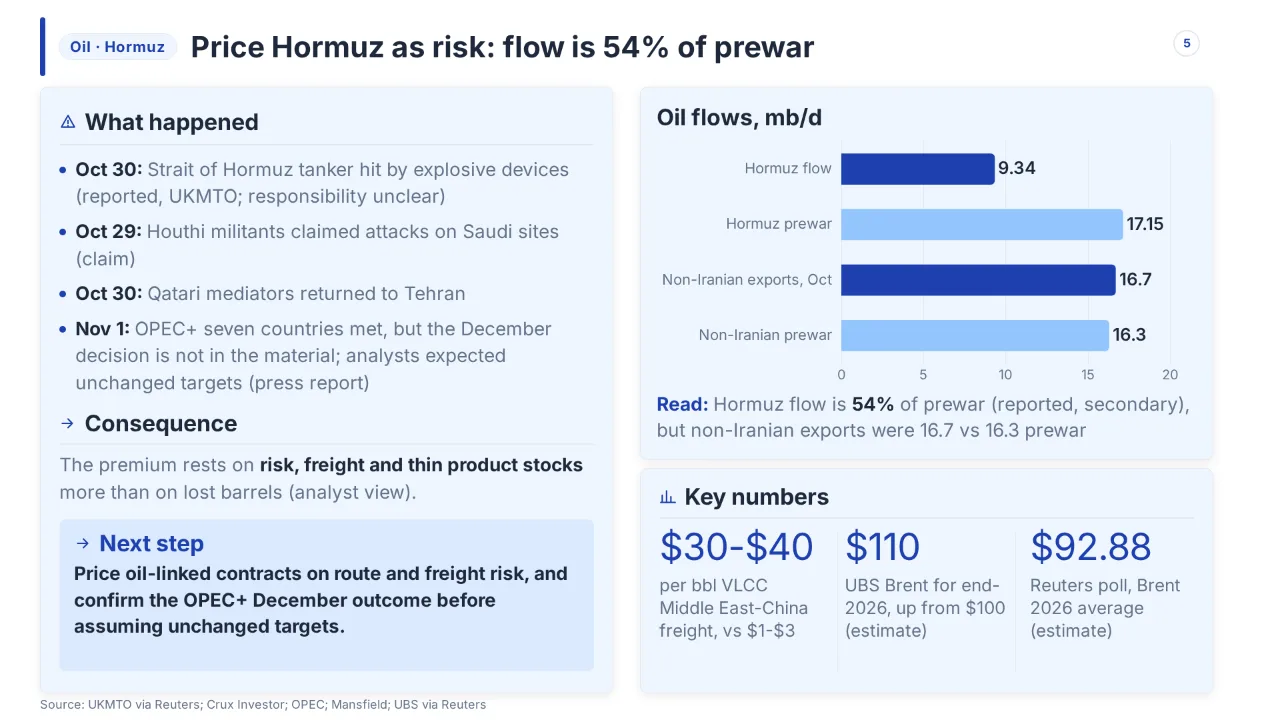
    Price Hormuz as risk, because the premium rests on risk, freight and thin product stocks more than on lost barrels, in analysts' view. Hormuz oil flow is 9.34 million barrels a day, 54% of the 17.15 prewar level, from a secondary report. Non-Iranian Middle East exports were 16.7 million in October against 16.3 prewar. VLCC Middle East-China freight is $30 to $40 a barrel, against $1 to $3. A tanker was hit by explosive devices on Oct 30, reported by UKMTO, with responsibility unclear. The OPEC+ December decision is not in the material, so confirm it. Next, gas, where two markets split.

    页面文字

    Oil · Hormuz

    Price Hormuz as risk: flow is 54% of prewar

    Source: UKMTO via Reuters; Crux Investor; OPEC; Mansfield; UBS via Reuters

    What happened

    Oct 30: Strait of Hormuz tanker hit by explosive devices (reported, UKMTO; responsibility unclear)

    Oct 29: Houthi militants claimed attacks on Saudi sites (claim)

    Oct 30: Qatari mediators returned to Tehran

    Nov 1: OPEC+ seven countries met, but the December decision is not in the material; analysts expected unchanged targets (press report)

    Consequence

    The premium rests on risk, freight and thin product stocks more than on lost barrels (analyst view).

    Next step

    Price oil-linked contracts on route and freight risk, and confirm the OPEC+ December outcome before assuming unchanged targets.

    Oil flows, mb/d

    Read: Hormuz flow is 54% of prewar (reported, secondary), but non-Iranian exports were 16.7 vs 16.3 prewar

    Key numbers

    $30-$40

    per bbl VLCC Middle East-China freight, vs $1-$3

    $110

    UBS Brent for end-2026, up from $100 (estimate)

    $92.88

    Reuters poll, Brent 2026 average (estimate)

    数据出处
    【本页依据】 ① A tanker in the Strait of Hormuz was hit by explosive devices on Oct 30 (UKMTO; responsibility unclear) —— Oil set for fourth monthly gain as Hormuz tanker attack highlights supply risks | Reuters · reuters.com · https://www.reuters.com/business/energy/oil-rises-supply-concerns-hout… ② Houthi militants claimed attacks on Saudi sites on Oct 29; Qatari mediators returned to Tehran on Oct 30 —— Same as ① ③ OPEC+ seven countries met on Nov 1; December decision not in material, analysts expected unchanged targets —— Organization of the Petroleum Exporting Countries · opec.org · https://www.opec.org/pr-detail/620-1-november-2026.html;Week in Review - Middle East Disruptions Push Oil Forecasts Higher While Demand Weakens - Mansfield Energy · mansfield.energy · https://mansfield.energy/2026/10/30/week-in-review-middle-east-disrupt… ④ Hormuz oil flow 9.34 mb/d, 54% of the 17.15 mb/d prewar level; non-Iranian Middle East exports 16.7 vs 16.3 mb/d prewar —— Hormuz at 54% of Prewar Flows Inflates Brent, Capping WTI Downside - Article | Crux Investor · cruxinvestor.com · https://www.cruxinvestor.com/posts/hormuz-at-54-of-prewar-flows-inflat… ⑤ VLCC Middle East-China freight $30-$40/bbl vs $1-$3; UBS Brent end-2026 $110, up from $100 —— UBS raises Brent outlook, sees oil at $110/bbl by end-2026 | Reuters · reuters.com · https://www.reuters.com/business/energy/ubs-raises-brent-outlook-sees-… ⑥ Reuters poll Brent 2026 average $92.88 (estimate) —— Week in Review - Middle East Disruptions Push Oil Forecasts Higher While Demand Weakens - Mansfield Energy · mansfield.energy · https://mansfield.energy/2026/10/30/week-in-review-middle-east-disrupt…
  6. 第 6 页:Gas · Regions|Treat Henry Hub and TTF as two markets

    第 6 页

    Gas · Regions|Treat Henry Hub and TTF as two markets

    讲稿

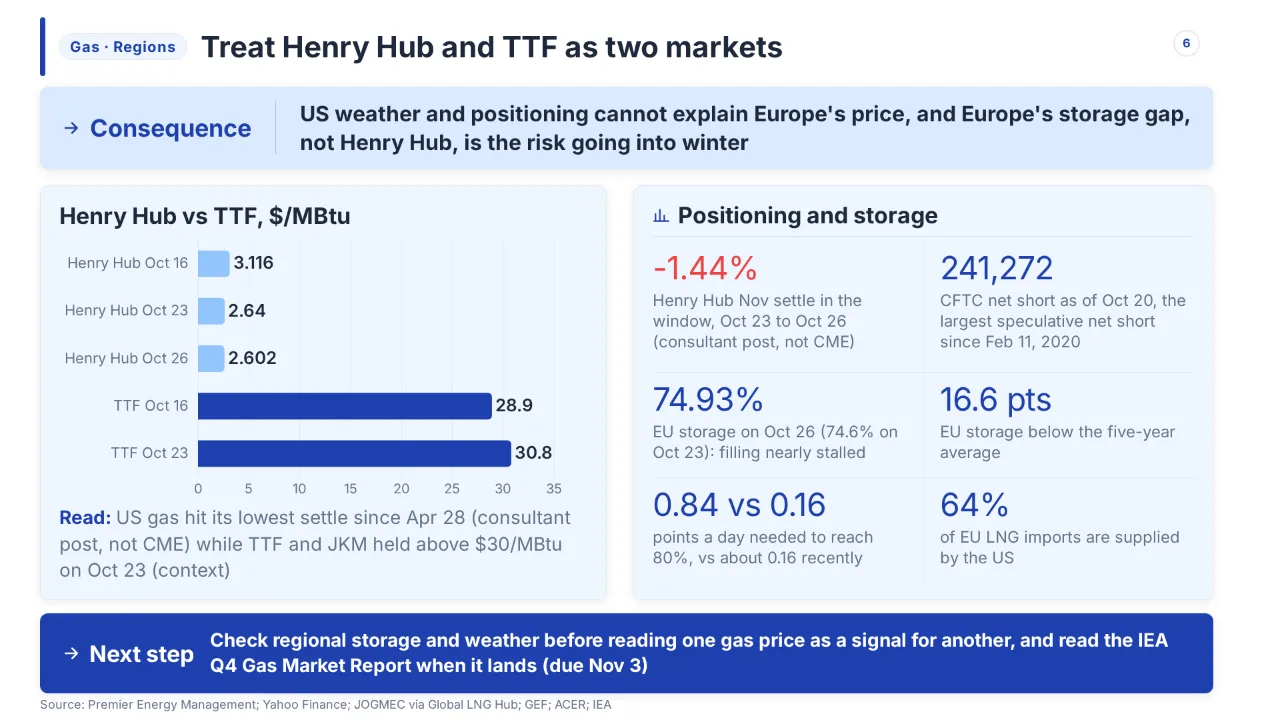
    Treat Henry Hub and TTF as two markets. US Henry Hub November settled at $2.602 on Oct 26, down 1.44% in the window and the lowest settle since Apr 28, per a consultant post, not CME. Speculators held a net short of 241,272 as of Oct 20, the largest since Feb 11, 2020. In Europe, storage was 74.93% on Oct 26, 16.6 points below the five-year average, and reaching 80% needs 0.84 points a day against about 0.16 recently. TTF and JKM held above $30 per MBtu on Oct 23. Europe's storage gap is the winter risk, not Henry Hub. The IEA Q4 report is due Nov 3. Next, precious metals.

    页面文字

    Gas · Regions

    Treat Henry Hub and TTF as two markets

    Source: Premier Energy Management; Yahoo Finance; JOGMEC via Global LNG Hub; GEF; ACER; IEA

    Consequence

    US weather and positioning cannot explain Europe's price, and Europe's storage gap, not Henry Hub, is the risk going into winter

    Henry Hub vs TTF, $/MBtu

    Read: US gas hit its lowest settle since Apr 28 (consultant post, not CME) while TTF and JKM held above $30/MBtu on Oct 23 (context)

    Positioning and storage

    -1.44%

    Henry Hub Nov settle in the window, Oct 23 to Oct 26 (consultant post, not CME)

    241,272

    CFTC net short as of Oct 20, the largest speculative net short since Feb 11, 2020

    74.93%

    EU storage on Oct 26 (74.6% on Oct 23): filling nearly stalled

    16.6 pts

    EU storage below the five-year average

    0.84 vs 0.16

    points a day needed to reach 80%, vs about 0.16 recently

    64%

    of EU LNG imports are supplied by the US

    Next step

    Check regional storage and weather before reading one gas price as a signal for another, and read the IEA Q4 Gas Market Report when it lands (due Nov 3)

    数据出处
    【本页依据】 ① Henry Hub November $3.116 on Oct 16, about $2.64 on Oct 23, $2.602 on Oct 26 (-1.44%), lowest settle since Apr 28 —— Wall Street Is Betting Big Against Natural Gas as a Mild Winter Looms · finance.yahoo.com · https://finance.yahoo.com/markets/commodities/articles/wall-street-bet… Gas Prices Fall 5.6% to 2.64/MMBtu | Premier Energy Management LLC posted on the topic | LinkedIn · linkedin.com · https://www.linkedin.com/posts/premier-energy-management-llc_naturalga… ② CFTC net short 241,272 as of Oct 20, the largest speculative net short since Feb 11, 2020 —— Wall Street Is Betting Big Against Natural Gas as a Mild Winter Looms · finance.yahoo.com · https://finance.yahoo.com/markets/commodities/articles/wall-street-bet… ③ TTF rose from $28.9 to $30.8/MBtu from Oct 16 to Oct 23; JKM in the high $31s —— Natural gas prices weekly update – JKM, TTF and Henry Hub (26 October 2026) | Global LNG Hub · globallnghub.com · https://globallnghub.com/natural-gas-prices-weekly-update-jkm-ttf-and-… ④ EU storage 74.6% on Oct 23 and 74.93% on Oct 26, 16.6 points below the five-year average; 80% needs 0.84 points a day vs about 0.16 recently —— Natural gas prices weekly update – JKM, TTF and Henry Hub (26 October 2026) | Global LNG Hub · globallnghub.com · https://globallnghub.com/natural-gas-prices-weekly-update-jkm-ttf-and-… Gas Storage Trajectory — Fill Curve vs 5-Year Norm · global-energy-flow.com · https://global-energy-flow.com/storage/trajectory ⑤ The US supplies 64% of EU LNG imports —— European gas markets - Summer 2026 - acer.europa.eu · acer.europa.eu · https://www.acer.europa.eu/sites/default/files/documents/Publications/… ⑥ IEA Q4 Gas Market Report is due Nov 3 —— Heat Pump Monitor 2026: Webinar (afternoon session) - Event - IEA · iea.org · https://www.iea.org/events/heat-pump-monitor-2026-webinar-afternoon-se…
  7. 第 7 页:Gold · Rates|Check hike odds before reading gold as a haven

    第 7 页

    Gold · Rates|Check hike odds before reading gold as a haven

    讲稿

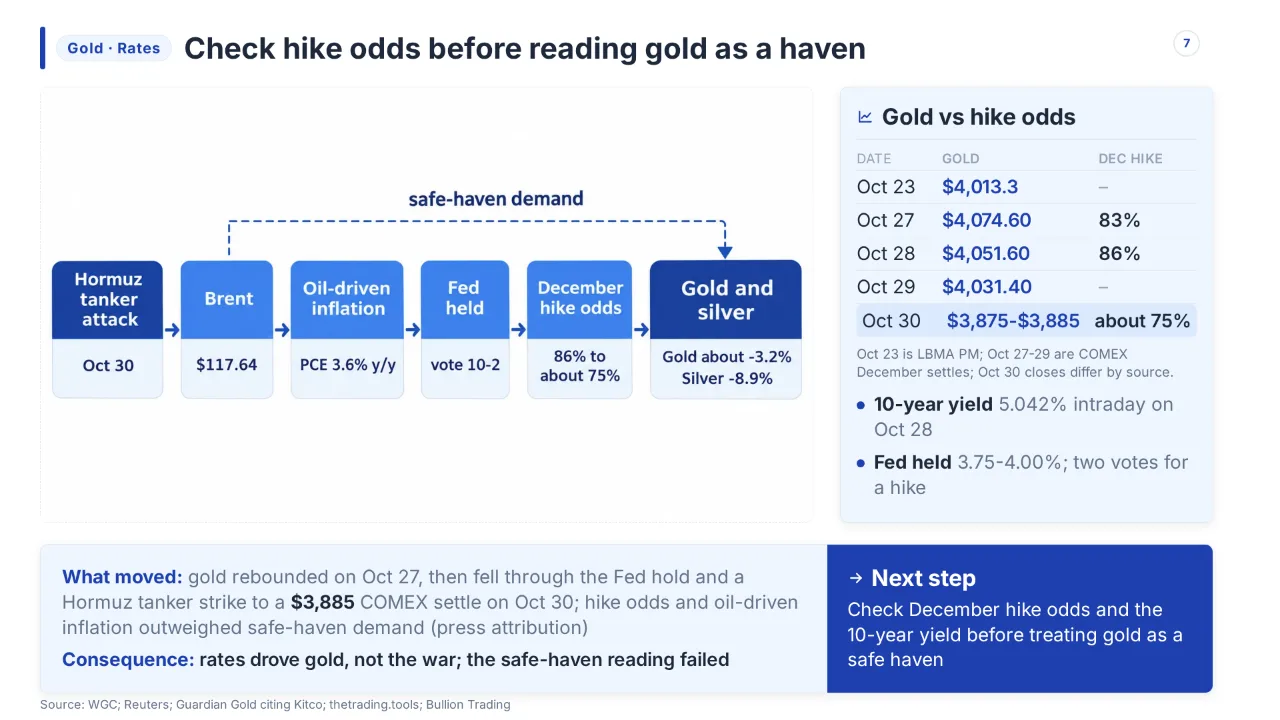
    Check hike odds before reading gold as a haven. Gold rebounded on Oct 27, then fell through the Fed hold and a Hormuz tanker strike to a COMEX settle of $3,885 on Oct 30, about 3.2% below the LBMA PM price of $4,013.3 on Oct 23, so the benchmarks are mixed. The Fed held at 3.75 to 4.00% by 10 to 2, with two votes for a hike. CME FedWatch December hike odds were 83% on Oct 27, 86% on Oct 28 and about 75% on Oct 30. The 10-year yield reached 5.042% intraday on Oct 28. Rates drove gold, not the war. Next, silver.

    页面文字

    Gold · Rates

    Check hike odds before reading gold as a haven

    Source: WGC; Reuters; Guardian Gold citing Kitco; thetrading.tools; Bullion Trading

    Gold vs hike odds

    Date

    Gold

    Dec hike

    Oct 23

    $4,013.3

    –

    Oct 27

    $4,074.60

    83%

    Oct 28

    $4,051.60

    86%

    Oct 29

    $4,031.40

    –

    Oct 30

    $3,875-$3,885

    about 75%

    Oct 23 is LBMA PM; Oct 27-29 are COMEX December settles; Oct 30 closes differ by source.

    10-year yield 5.042% intraday on Oct 28

    Fed held 3.75-4.00%; two votes for a hike

    What moved: gold rebounded on Oct 27, then fell through the Fed hold and a Hormuz tanker strike to a $3,885 COMEX settle on Oct 30; hike odds and oil-driven inflation outweighed safe-haven demand (press attribution)

    Consequence: rates drove gold, not the war; the safe-haven reading failed

    Next step

    Check December hike odds and the 10-year yield before treating gold as a safe haven

    数据出处
    【本页依据】 ① COMEX December gold settled $4,074.60, $4,051.60 and $4,031.40 on Oct 27, 28 and 29 —— Gold gains on softer oil prices ahead of Fed meeting | Reuters · reuters.com · https://www.reuters.com/world/india/gold-eases-firmer-dollar-ahead-fed… slips on higher oil; markets assess Warsh comments after Fed holds rates steady | Reuters · reuters.com · https://www.reuters.com/business/gold-slips-oil-fuelled-inflation-fear… Summary - Precious Metals Prices 30/10/2026 · guardian-gold.com.au · https://guardian-gold.com.au/market-updates/overnight-summary-precious… ② Gold fell about 3.2% from LBMA PM $4,013.3 on Oct 23 to a $3,885 COMEX settle on Oct 30 (mixed benchmarks) —— Weekly Markets Monitor · gold.org · https://www.gold.org/download/file/21299/WMM_26_Oct_2026_Chill_and_boo… Price Today and Since 1960, With Every 20% Decline | thetrading.tools · thetrading.tools · https://www.thetrading.tools/gold-price ③ Oct 30 gold closes were $3,875-$3,885 depending on source —— Gold Price Today and Since 1960, With Every 20% Decline | thetrading.tools · thetrading.tools · https://www.thetrading.tools/gold-price;Gold and silver slid to fresh lows (Oct 30, 2026) · bulliontradingllc.com · https://bulliontradingllc.com/news/2026-10-30;Gold Price Drops Below Key Support as GLD ETF Outflows Jump as NFP Loom - SPDR Gold Shares (ARCA:GLD),… · benzinga.com · https://www.benzinga.com/markets/commodities/26/10/62764029/gold-price… ④ The Fed held 3.75-4.00% by 10-2 with two votes for a hike —— Fed rate decision live: FOMC holds rates steady after September hike | Reuters · reuters.com · https://www.reuters.com/live/fed-rate-decision-live-live-fomc-expected… View: FOMC holds rates steady, markets rise modestly | Reuters · reuters.com · https://www.reuters.com/business/view-fomc-holds-rates-steady-markets-… ⑤ CME FedWatch December hike odds 83% on Oct 27, 86% on Oct 28 and about 75% on Oct 30 —— Gold gains on softer oil prices ahead of Fed meeting | Reuters · reuters.com · https://www.reuters.com/world/india/gold-eases-firmer-dollar-ahead-fed… slips on higher oil; markets assess Warsh comments after Fed holds rates steady | Reuters · reuters.com · https://www.reuters.com/business/gold-slips-oil-fuelled-inflation-fear… slips as higher oil, US inflation data bolster Fed hike bets | Reuters · reuters.com · https://www.reuters.com/world/india/gold-slips-higher-oil-us-inflation… ⑥ 10-year yield 5.042% intraday on Oct 28 —— Instant View: FOMC holds rates steady, markets rise modestly | Reuters · reuters.com · https://www.reuters.com/business/view-fomc-holds-rates-steady-markets-… slips on higher oil; markets assess Warsh comments after Fed holds rates steady | Reuters · reuters.com · https://www.reuters.com/business/gold-slips-oil-fuelled-inflation-fear…
  8. 第 8 页:Silver · Flows|Silver fell 8.9% to $49.12 as ETF money left

    第 8 页

    Silver · Flows|Silver fell 8.9% to $49.12 as ETF money left

    讲稿

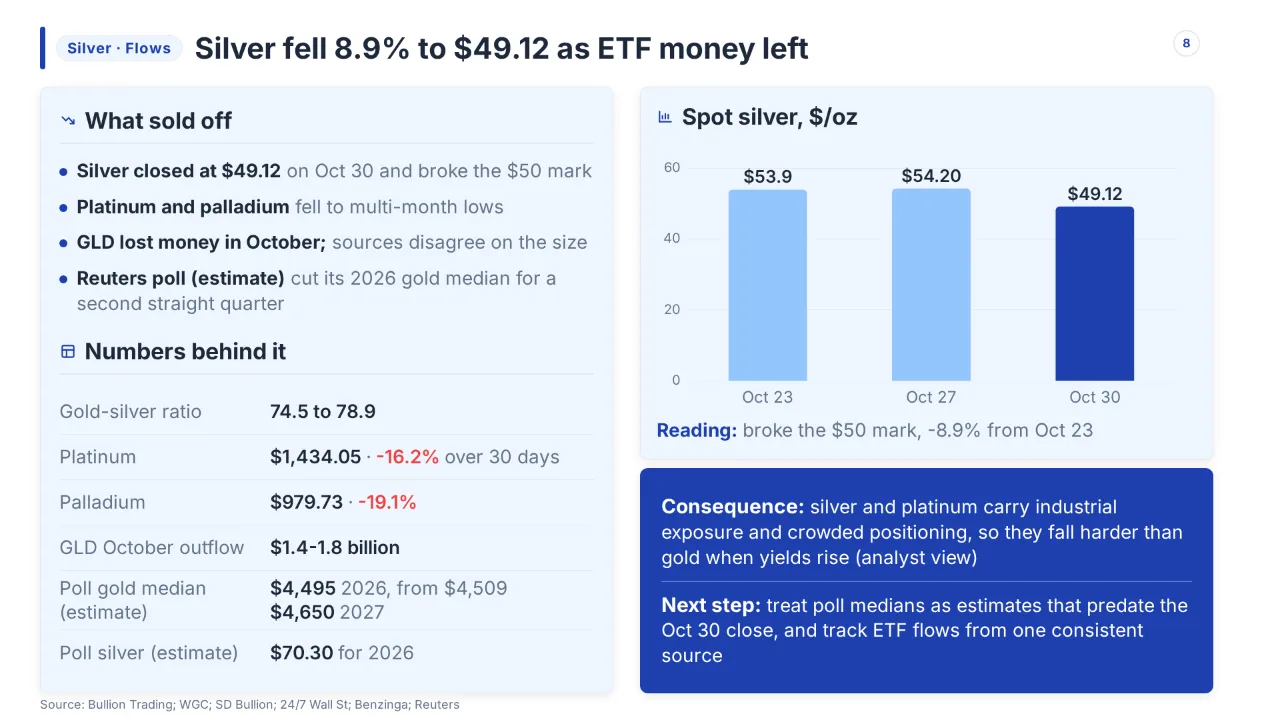
    Silver fell 8.9% to $49.12 as ETF money left. It was $53.9 on Oct 23 and closed at $49.12 on Oct 30, breaking the $50 mark. Platinum fell to $1,434.05, down 16.2% over 30 days, and palladium to $979.73, down 19.1%. GLD lost $1.4 to $1.8 billion in October, as sources disagree on the size. Analysts say silver and platinum carry industrial exposure and crowded positioning, so they fall harder than gold when yields rise. A Reuters poll put the 2026 gold median at $4,495, but that is an estimate predating the Oct 30 close. Next, copper.

    页面文字

    Silver · Flows

    Silver fell 8.9% to $49.12 as ETF money left

    Source: Bullion Trading; WGC; SD Bullion; 24/7 Wall St; Benzinga; Reuters

    What sold off

    Silver closed at $49.12 on Oct 30 and broke the $50 mark

    Platinum and palladium fell to multi-month lows

    GLD lost money in October; sources disagree on the size

    Reuters poll (estimate) cut its 2026 gold median for a second straight quarter

    Numbers behind it

    Gold-silver ratio

    74.5 to 78.9

    Platinum

    $1,434.05 · -16.2% over 30 days

    Palladium

    $979.73 · -19.1%

    GLD October outflow

    $1.4-1.8 billion

    Poll gold median (estimate)

    $4,495 2026, from $4,509

    $4,650 2027

    Poll silver (estimate)

    $70.30 for 2026

    Spot silver, $/oz

    Reading: broke the $50 mark, -8.9% from Oct 23

    Consequence: silver and platinum carry industrial exposure and crowded positioning, so they fall harder than gold when yields rise (analyst view)

    Next step: treat poll medians as estimates that predate the Oct 30 close, and track ETF flows from one consistent source

    数据出处
    【本页依据】 ① Silver $53.9 on Oct 23, $54.20 on Oct 27, $49.12 on Oct 30 (-8.9%), breaking the $50 mark —— Weekly Markets Monitor · gold.org · https://www.gold.org/download/file/21299/WMM_26_Oct_2026_Chill_and_boo… gains on softer oil prices ahead of Fed meeting | Reuters · reuters.com · https://www.reuters.com/world/india/gold-eases-firmer-dollar-ahead-fed… and silver slid to fresh lows (Oct 30, 2026) · bulliontradingllc.com · https://bulliontradingllc.com/news/2026-10-30 ② Gold-silver ratio rose from 74.5 to 78.9 —— Weekly Markets Monitor · gold.org · https://www.gold.org/download/file/21299/WMM_26_Oct_2026_Chill_and_boo… and silver slid to fresh lows (Oct 30, 2026) · bulliontradingllc.com · https://bulliontradingllc.com/news/2026-10-30 ③ Platinum $1,434.05 (-16.2% over 30 days) and palladium $979.73 (-19.1%) —— Gold and silver slid to fresh lows (Oct 30, 2026) · bulliontradingllc.com · https://bulliontradingllc.com/news/2026-10-30 ④ GLD October outflow of $1.4-1.8 billion —— GLD Suffers $1.8 Billion October Outflow, Its Worst Since June | 24/7 Wall St. · 247wallst.com · https://247wallst.com/cards/gld-xpost-01m6bz8nwm19s4pt486bnv31y2;Gold Price Drops Below Key Support as GLD ETF Outflows Jump as NFP Loom - SPDR Gold Shares (ARCA:GLD),… · benzinga.com · https://www.benzinga.com/markets/commodities/26/10/62764029/gold-price… ⑤ Reuters poll gold median $4,495 for 2026 (from $4,509) and $4,650 for 2027 —— POLL Strong dollar, high yields drag on gold outlook, but central-bank demand lends support | Reuters · reuters.com · https://www.reuters.com/world/china/strong-dollar-high-yields-drag-gol… ⑥ Reuters poll silver average $70.30 for 2026 —— Same as ⑤
  9. 第 9 页:Copper · Markets|Read LME price and China premium together

    第 9 页

    Copper · Markets|Read LME price and China premium together

    讲稿

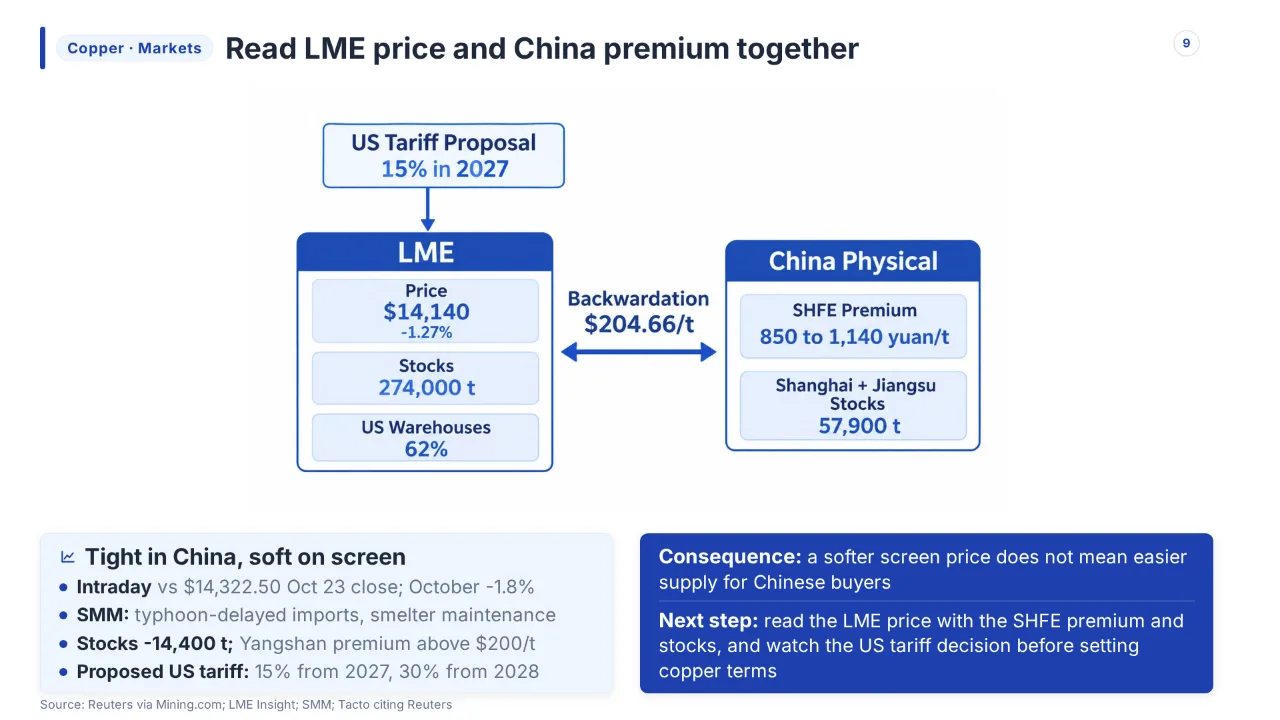
    Silver was a story about fund flows; copper is a story about two markets moving apart, so read the LME price together with the China premium. LME three-month copper was $14,140 at 17:20 GMT on October 30, down 1.27% from the $14,322.50 close on October 23, an intraday print against a close, and October is heading for a 1.8% fall. In China, SMM cites typhoon-delayed imports and smelter maintenance: the SHFE spot premium rose from 850 to 1,140 yuan a tonne, and Shanghai plus Jiangsu stocks fell 14,400 tonnes to 57,900. A softer screen price does not mean easier supply for Chinese buyers. Next, the other base metals.

    页面文字

    Copper · Markets

    Read LME price and China premium together

    Source: Reuters via Mining.com; LME Insight; SMM; Tacto citing Reuters

    Tight in China, soft on screen

    Intraday vs $14,322.50 Oct 23 close; October -1.8%

    SMM: typhoon-delayed imports, smelter maintenance

    Stocks -14,400 t; Yangshan premium above $200/t

    Proposed US tariff: 15% from 2027, 30% from 2028

    Consequence: a softer screen price does not mean easier supply for Chinese buyers

    Next step: read the LME price with the SHFE premium and stocks, and watch the US tariff decision before setting copper terms

    数据出处
    【本页依据】 ① LME three-month copper $14,140 at 17:20 GMT on Oct 30 vs $14,322.50 close on Oct 23, -1.27% —— Copper price set for first monthly loss since June as AI spending worries weigh - MINING.COM · mining.com · https://www.mining.com/web/copper-price-set-for-first-monthly-loss-sin… LME Weekly Review: 19-23 October 2026 · lmeinsight.com · https://www.lmeinsight.com/the-lme-weekly-review-19-23-october-2026 ② October heading for a 1.8% fall in LME copper —— Copper price set for first monthly loss since June as AI spending worries weigh - MINING.COM · mining.com · https://www.mining.com/web/copper-price-set-for-first-monthly-loss-sin… ③ SHFE spot copper premium rose from 850 to 1,140 yuan/t —— US economic resilience strengthens rate hike expectations, copper prices consolidate under pressure [SMM Copper Morning Meeting Summary] - Shanghai Metals Market (SMM) · news.metal.com · https://news.metal.com/newscontent/104186849-us-economic-resilience-st… supply "cleared within 1-2 days"; invoices and invoice tax rates choke off volume growth [SMM Copper Scrap Weekly Review] - Shanghai Metals Market (SMM) · news.metal.com · https://news.metal.com/newscontent/104187231-tax-inclusive-supply-clea… ④ Shanghai plus Jiangsu copper stocks 57,900 t, down 14,400 t; SMM cites typhoon-delayed imports and smelter maintenance —— Inventory destocking continues, coupled with tight supply, driving Shanghai spot copper premiums gradually higher [SMM SHFE Copper Spot Weekly Review] - Shanghai Metals Market (SMM) · news.metal.com · https://news.metal.com/en/newscontent/104186721-inventory-destocking-c… deficit continues to intensify, Yangshan copper premiums hit a historic high [SMM Yangshan Copper Weekly Review] - Shanghai Metals Market (SMM) · news.metal.com · https://news.metal.com/en/newscontent/104186448-supply-deficit-continu… ⑤ LME stocks 274,000 t; cash-to-3M backwardation $204.66/t —— Copper Retreats to $14,310 as China Stocks Drop 27% · minelistings.com · https://minelistings.com/news/copper-retreats-to-14310-as-china-invent… deficit continues to intensify, Yangshan copper premiums hit a historic high [SMM Yangshan Copper Weekly Review] - Shanghai Metals Market (SMM) · news.metal.com · https://news.metal.com/en/newscontent/104186448-supply-deficit-continu… LME Weekly Review: 19-23 October 2026 · lmeinsight.com · https://www.lmeinsight.com/the-lme-weekly-review-19-23-october-2026 ⑥ Proposed US refined-copper tariff 15% from 2027 and 30% from 2028, undecided; about 62% of LME stocks in US warehouses —— Copper Price Today: Price, Trends & Forecast 2026 | Tacto · tacto.ai · https://www.tacto.ai/en/commodities/copper-price
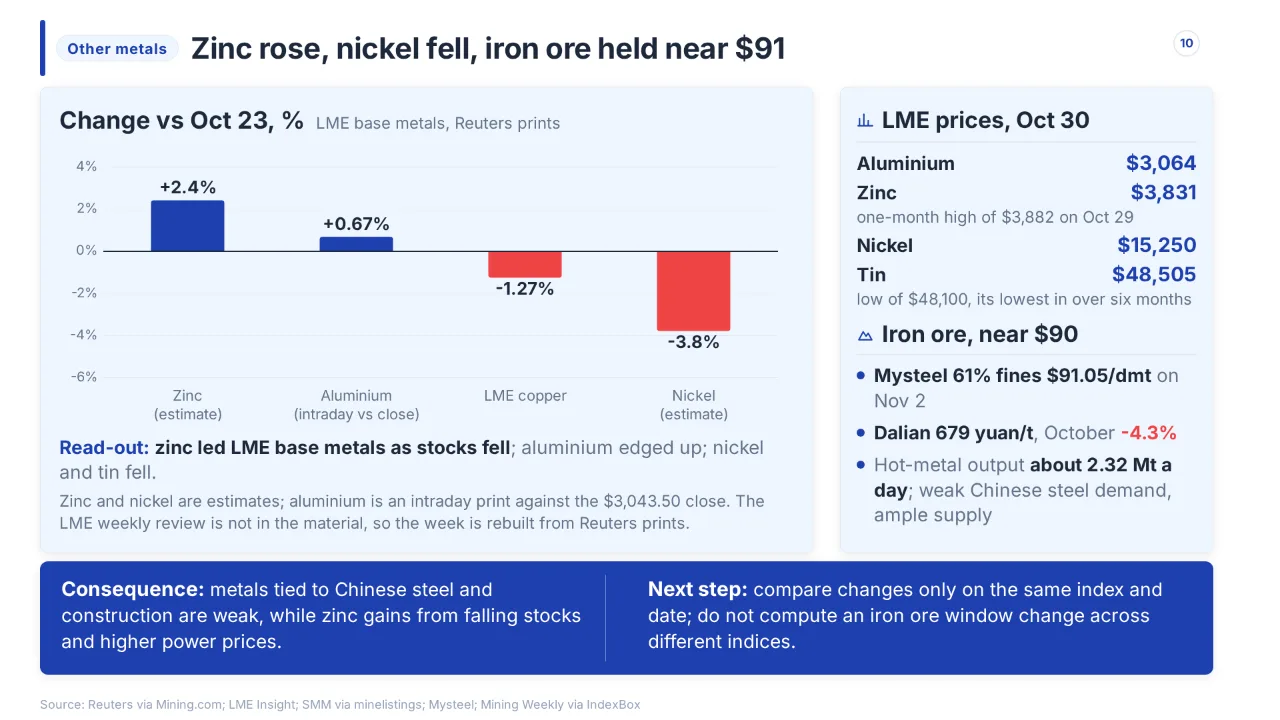
  10. 第 10 页:Other metals|Zinc rose, nickel fell, iron ore held near $91

    第 10 页

    Other metals|Zinc rose, nickel fell, iron ore held near $91

    讲稿

    Copper was one story; the other base metals went different ways. Zinc led the LME base metals as stocks fell, reaching $3,831 on October 30, about 2.4% higher, an estimate, after a one-month high of $3,882 on October 29. Aluminium edged up to $3,064, plus 0.67% against the $3,043.50 close, intraday versus close. Nickel fell to $15,250, about 3.8% lower, also an estimate, and tin to $48,505 after touching $48,100, its lowest in over six months. Iron ore stayed near $90, with Mysteel's 61% fines at $91.05 a dry tonne on November 2, with weak Chinese steel demand and ample supply. Compare changes only on the same index and date. Lithium is next.

    页面文字

    Other metals

    Zinc rose, nickel fell, iron ore held near $91

    Source: Reuters via Mining.com; LME Insight; SMM via minelistings; Mysteel; Mining Weekly via IndexBox

    Change vs Oct 23, %

    LME base metals, Reuters prints

    Read-out: zinc led LME base metals as stocks fell ; aluminium edged up; nickel and tin fell.

    Zinc and nickel are estimates; aluminium is an intraday print against the $3,043.50 close. The LME weekly review is not in the material, so the week is rebuilt from Reuters prints.

    LME prices, Oct 30

    Aluminium $3,064

    Zinc $3,831

    one-month high of $3,882 on Oct 29

    Nickel $15,250

    Tin $48,505

    low of $48,100, its lowest in over six months

    Iron ore, near $90

    Mysteel 61% fines $91.05/dmt on Nov 2

    Dalian 679 yuan/t , October -4.3%

    Hot-metal output about 2.32 Mt a day ; weak Chinese steel demand, ample supply

    Consequence: metals tied to Chinese steel and construction are weak, while zinc gains from falling stocks and higher power prices.

    Next step: compare changes only on the same index and date; do not compute an iron ore window change across different indices.

    数据出处
    【本页依据】 ① Aluminium $3,064 on Oct 30, +0.67% vs the $3,043.50 close —— Copper price set for first monthly loss since June as AI spending worries weigh - MINING.COM · mining.com · https://www.mining.com/web/copper-price-set-for-first-monthly-loss-sin… LME Weekly Review: 19-23 October 2026 · lmeinsight.com · https://www.lmeinsight.com/the-lme-weekly-review-19-23-october-2026 ② Zinc $3,831 on Oct 30, about +2.4% (estimate), after a one-month high of $3,882 on Oct 29 —— Copper price set for first monthly loss since June as AI spending worries weigh - MINING.COM · mining.com · https://www.mining.com/web/copper-price-set-for-first-monthly-loss-sin… Retreats to $14,310 as China Stocks Drop 27% · minelistings.com · https://minelistings.com/news/copper-retreats-to-14310-as-china-invent… price hits two-week high as tight stocks spur bullish sentiment - Mining.com.au · mining.com.au · https://mining.com.au/zinc-hits-two-week-high-as-stocks-tighten ③ Nickel $15,250, about -3.8% (estimate) —— Copper price set for first monthly loss since June as AI spending worries weigh - MINING.COM · mining.com · https://www.mining.com/web/copper-price-set-for-first-monthly-loss-sin… price hits two-week high as tight stocks spur bullish sentiment - Mining.com.au · mining.com.au · https://mining.com.au/zinc-hits-two-week-high-as-stocks-tighten ④ Tin $48,505, low of $48,100, its lowest in over six months —— Copper price set for first monthly loss since June as AI spending worries weigh - MINING.COM · mining.com · https://www.mining.com/web/copper-price-set-for-first-monthly-loss-sin… ⑤ Mysteel 61% fines $91.05/dmt on Nov 2 —— Latest Analysis about China Steel & Commodities Market | Mysteel · mysteel.net · https://www.mysteel.net/market-insights/analysis ⑥ Dalian iron ore 679 yuan/t, October -4.3%; hot-metal output about 2.32 Mt a day —— Iron-Ore Prices Rise After Sharp Declines as Chinese Demand Holds Up - News and Statistics - IndexBox · indexbox.io · https://www.indexbox.io/blog/iron-ore-prices-edge-higher-after-two-mon…
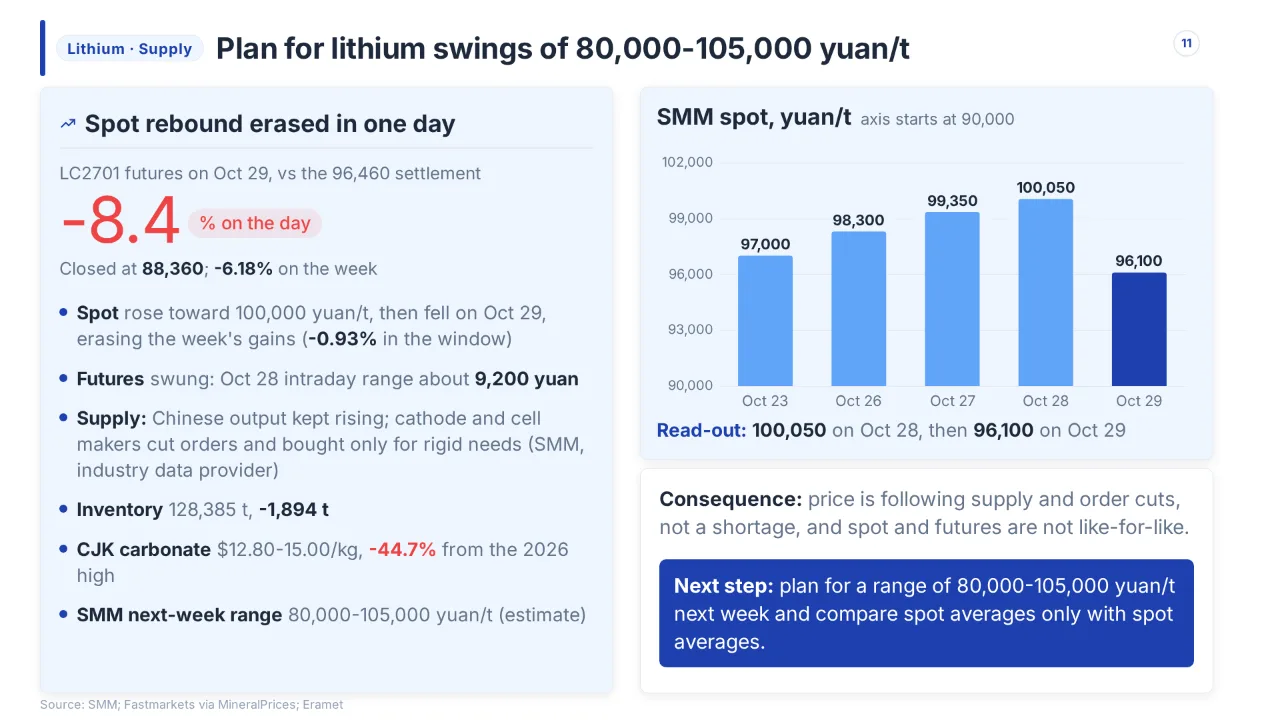
  11. 第 11 页:Lithium · Supply|Plan for lithium swings of 80,000-105,000 yuan/t

    第 11 页

    Lithium · Supply|Plan for lithium swings of 80,000-105,000 yuan/t

    讲稿

    Iron ore tracks Chinese steel; lithium is about supply, so plan for swings of 80,000 to 105,000 yuan a tonne next week, SMM's estimate. SMM, an industry data provider, had spot rising from 97,000 on October 23 to 100,050 on October 28, then falling to 96,100 on October 29, down 0.93% over the window. The LC2701 future closed at 88,360 on October 29, down 8.4% on the day against the 96,460 settlement, and down 6.18% on the week. Chinese output kept rising while cathode and cell makers cut orders. So price is following supply, not shortage, and spot and futures are not like for like. Next, nickel and cobalt.

    页面文字

    Lithium · Supply

    Plan for lithium swings of 80,000-105,000 yuan/t

    Source: SMM; Fastmarkets via MineralPrices; Eramet

    Spot rebound erased in one day

    LC2701 futures on Oct 29, vs the 96,460 settlement

    -8.4 % on the day

    Closed at 88,360 ; -6.18% on the week

    Spot rose toward 100,000 yuan/t, then fell on Oct 29, erasing the week's gains ( -0.93% in the window)

    Futures swung: Oct 28 intraday range about 9,200 yuan

    Supply: Chinese output kept rising; cathode and cell makers cut orders and bought only for rigid needs (SMM, industry data provider)

    Inventory 128,385 t, -1,894 t

    CJK carbonate $12.80-15.00/kg, -44.7% from the 2026 high

    SMM next-week range 80,000-105,000 yuan/t (estimate)

    SMM spot, yuan/t

    axis starts at 90,000

    Read-out: 100,050 on Oct 28, then 96,100 on Oct 29

    Consequence: price is following supply and order cuts, not a shortage, and spot and futures are not like-for-like.

    Next step: plan for a range of 80,000-105,000 yuan/t next week and compare spot averages only with spot averages.

    数据出处
    【本页依据】 ① SMM spot lithium 97,000 yuan/t on Oct 23 rising to 100,050 on Oct 28, then 96,100 on Oct 29 (-0.93% in the window) —— [SMM Analysis] Lithium carbonate prices plunge this week, destocking slows down - Shanghai Metals Market (SMM) · news.metal.com · https://news.metal.com/newscontent/104186365-smm-analysis-lithium-carb… Lithium Carbonate Daily Review] On October 26, spot lithium carbonate stopped falling and rebounded, ending its previous consecutive decline. - Shanghai Metals Market (SMM) · news.metal.com · https://news.metal.com/newscontent/104179171-smm-lithium-carbonate-dai… Lithium Carbonate Daily Review] Lithium Carbonate Futures and Spot Prices Rebound in Tandem on October 27 - Shanghai Metals Market (SMM) · news.metal.com · https://news.metal.com/en/newscontent/104181671-smm-lithium-carbonate-… ② LC2701 closed at 88,360 on Oct 29, -8.4% on the day vs the 96,460 settlement, -6.18% on the week —— [SMM Analysis] Lithium carbonate prices plunge this week, destocking slows down - Shanghai Metals Market (SMM) · news.metal.com · https://news.metal.com/newscontent/104186365-smm-analysis-lithium-carb… Lithium Carbonate Daily Review] On October 28, spot lithium carbonate prices rose by 700 yuan/mt, while futures retreated after a rapid rise, falling on increased volume and open interest. - Shanghai Metals Market (SMM) · news.metal.com · https://news.metal.com/newscontent/104183966-smm-lithium-carbonate-dai… ③ Oct 28 LC2701 intraday range about 9,200 yuan —— [SMM Lithium Carbonate Daily Review] On October 28, spot lithium carbonate prices rose by 700 yuan/mt, while futures retreated after a rapid rise, falling on increased volume and open interest. - Shanghai Metals Market (SMM) · news.metal.com · https://news.metal.com/newscontent/104183966-smm-lithium-carbonate-dai… ④ Inventory 128,385 t, -1,894 t; cathode and cell makers cut orders, buy only for rigid needs —— [SMM Analysis] Lithium carbonate prices plunge this week, destocking slows down - Shanghai Metals Market (SMM) · news.metal.com · https://news.metal.com/newscontent/104186365-smm-analysis-lithium-carb… ⑤ SMM next-week range 80,000-105,000 yuan/t (estimate) —— Same as ④ ⑥ CJK carbonate $12.80-15.00/kg, -44.7% from the 2026 high —— Lithium, cobalt markets cautious on China’s demand – MineralPrices.com · mineralprices.com · https://mineralprices.com/lithium-cobalt-markets-cautious-on-chinas-de…
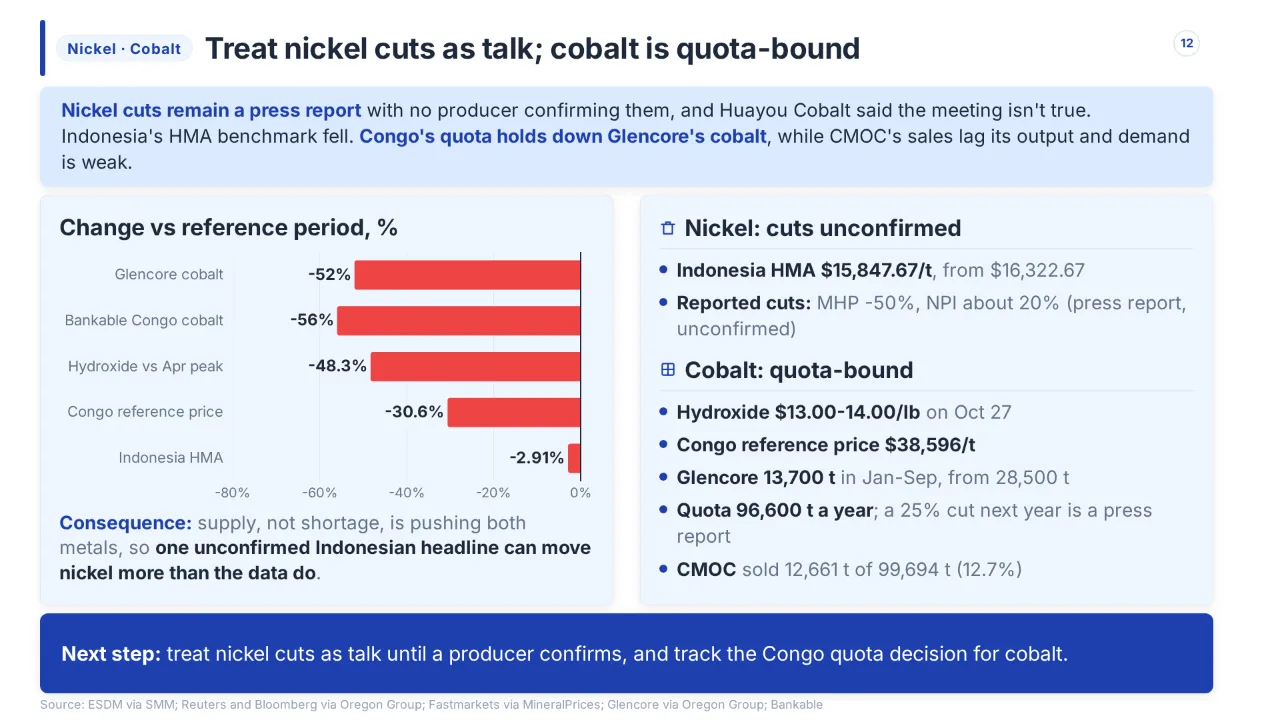
  12. 第 12 页:Nickel · Cobalt|Treat nickel cuts as talk; cobalt is quota-bound

    第 12 页

    Nickel · Cobalt|Treat nickel cuts as talk; cobalt is quota-bound

    讲稿

    Lithium fell on supply, and nickel and cobalt follow the same logic. Indonesian nickel cuts, reported as MHP down 50% and NPI about 20%, are still a press report: no producer has confirmed them, and Huayou Cobalt said the meeting is not true. Meanwhile Indonesia's HMA benchmark fell 2.91% to $15,847.67 a tonne. Cobalt is quota-bound. Congo's quota is 96,600 tonnes a year, and Glencore's cobalt was 13,700 tonnes in January to September, down 52% from 28,500. A 25% cut next year is also only a press report. So treat nickel cuts as talk until a producer confirms, and track the Congo quota decision. Next, the macro drivers.

    页面文字

    Nickel · Cobalt

    Treat nickel cuts as talk; cobalt is quota-bound

    Source: ESDM via SMM; Reuters and Bloomberg via Oregon Group; Fastmarkets via MineralPrices; Glencore via Oregon Group; Bankable

    Nickel cuts remain a press report with no producer confirming them, and Huayou Cobalt said the meeting isn't true. Indonesia's HMA benchmark fell. Congo's quota holds down Glencore's cobalt , while CMOC's sales lag its output and demand is weak.

    Change vs reference period, %

    Consequence: supply, not shortage, is pushing both metals, so one unconfirmed Indonesian headline can move nickel more than the data do .

    Nickel: cuts unconfirmed

    Indonesia HMA $15,847.67/t , from $16,322.67

    Reported cuts: MHP -50%, NPI about 20% (press report, unconfirmed)

    Cobalt: quota-bound

    Hydroxide $13.00-14.00/lb on Oct 27

    Congo reference price $38,596/t

    Glencore 13,700 t in Jan-Sep, from 28,500 t

    Quota 96,600 t a year ; a 25% cut next year is a press report

    CMOC sold 12,661 t of 99,694 t (12.7%)

    Next step: treat nickel cuts as talk until a producer confirms, and track the Congo quota decision for cobalt.

    数据出处
    【本页依据】 ① Indonesia HMA $15,847.67/t, -2.91% from $16,322.67 —— [SMM Nickel Ore Market Weekly Review] Indonesia's Benchmark Price Cut and Weak Demand Put Regional Nickel Ore Prices Under Pressure - Shanghai Metals Market (SMM) · news.metal.com · https://news.metal.com/newscontent/104189254-smm-nickel-ore-market-wee… ② Reported nickel cuts of MHP -50% and NPI about 20% are an unconfirmed press report; Huayou Cobalt said the meeting isn't true —— Nickel producers weigh 50% Indonesian cuts as prices hit 10-month low - The Oregon Group · theoregongroup.com · https://theoregongroup.com/latest-news/morowali-nickel-producers-coord… ③ Cobalt hydroxide $13.00-14.00/lb on Oct 27, -48.3% vs the Apr 27 peak —— Lithium, cobalt markets cautious on China’s demand – MineralPrices.com · mineralprices.com · https://mineralprices.com/lithium-cobalt-markets-cautious-on-chinas-de… ④ Congo reference price $38,596/t, -30.6% since early September —— Glencore's cobalt output falls 52% in nine months under Congo quotas - The Oregon Group · theoregongroup.com · https://theoregongroup.com/latest-news/glencore-cobalt-output-falls-52… ⑤ Glencore cobalt 13,700 t in Jan-Sep, -52% from 28,500 t —— Glencore's cobalt output falls 52% in nine months under Congo quotas - The Oregon Group · theoregongroup.com · https://theoregongroup.com/latest-news/glencore-cobalt-output-falls-52… cobalt output sinks 52% under DRC quotas - MINING.COM · mining.com · https://www.mining.com/glencore-cobalt-output-sinks-52-under-drc-quotas ⑥ Congo quota 96,600 t a year; a 25% cut next year is a press report; CMOC sold 12,661 t of 99,694 t (12.7%) —— Same as ④
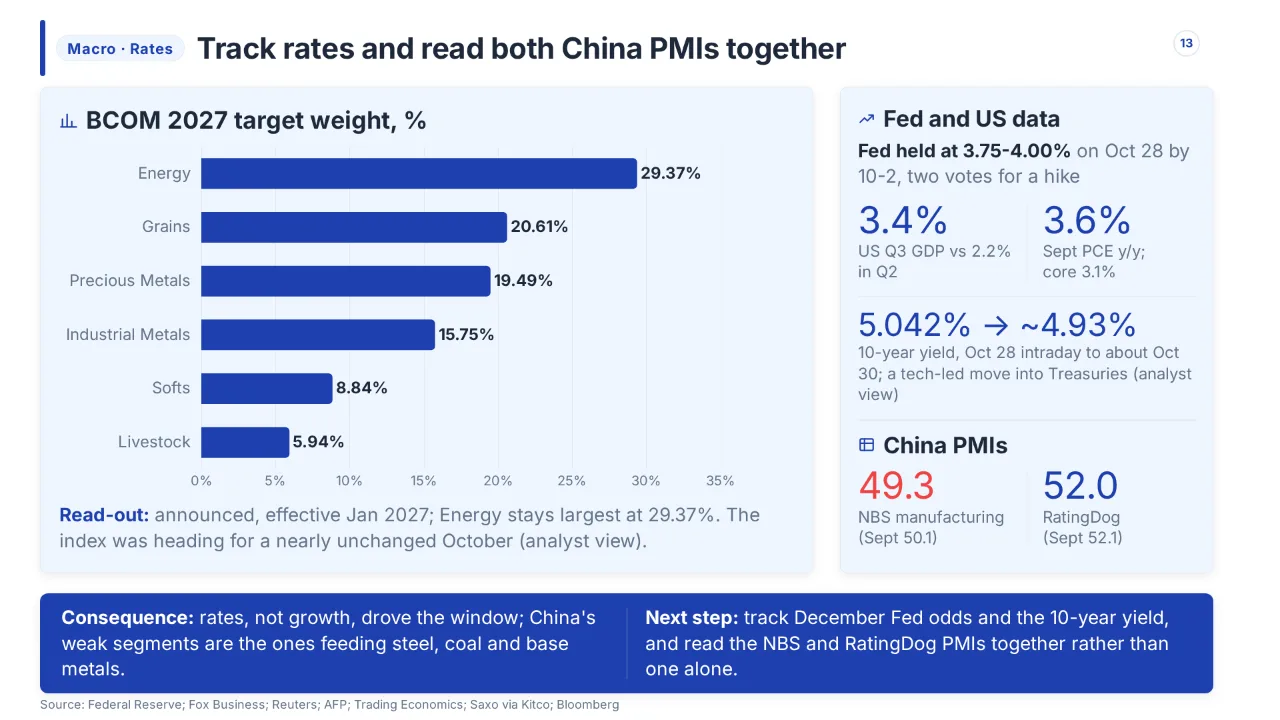
  13. 第 13 页:Macro · Rates|Track rates and read both China PMIs together

    第 13 页

    Macro · Rates|Track rates and read both China PMIs together

    讲稿

    Metals moved on supply, but the macro window was about rates. The Fed held at 3.75 to 4.00% on October 28 by 10 to 2, with two votes for a hike. US third-quarter GDP was 3.4% against 2.2% in the second quarter, and September PCE was 3.6% year on year. Even so, the 10-year yield eased from 5.042% intraday on October 28 to about 4.93% on October 30, which analysts tied to a tech-led move into Treasuries. In China, the NBS manufacturing PMI was 49.3, against 50.1 in September, while RatingDog was 52.0, so read both together. Next, the dates to plan around.

    页面文字

    Macro · Rates

    Track rates and read both China PMIs together

    Source: Federal Reserve; Fox Business; Reuters; AFP; Trading Economics; Saxo via Kitco; Bloomberg

    BCOM 2027 target weight, %

    Read-out: announced, effective Jan 2027; Energy stays largest at 29.37%. The index was heading for a nearly unchanged October (analyst view).

    Fed and US data

    Fed held at 3.75-4.00% on Oct 28 by 10-2, two votes for a hike

    3.4%

    US Q3 GDP vs 2.2% in Q2

    3.6%

    Sept PCE y/y; core 3.1%

    5.042% → ~4.93%

    10-year yield, Oct 28 intraday to about Oct 30; a tech-led move into Treasuries (analyst view)

    China PMIs

    49.3

    NBS manufacturing (Sept 50.1)

    52.0

    RatingDog (Sept 52.1)

    Consequence: rates, not growth, drove the window; China's weak segments are the ones feeding steel, coal and base metals.

    Next step: track December Fed odds and the 10-year yield, and read the NBS and RatingDog PMIs together rather than one alone.

    数据出处
    【本页依据】 ① Fed held at 3.75-4.00% on Oct 28 by 10-2, two votes for a hike —— Federal Reserve issues FOMC statement · federalreserve.gov · https://www.federalreserve.gov/monetarypolicy/files/monetary20261028a1… ② US Q3 GDP 3.4% vs 2.2% in Q2; September PCE 3.6% y/y, core 3.1% —— Fed’s preferred inflation gauge rose in September as third-quarter GDP beats expectations · foxbusiness.com · https://www.foxbusiness.com/economy/september-2026-pce-inflation ③ 10-year yield 5.042% intraday on Oct 28 to about 4.93% on Oct 30, tied to a tech-led move into Treasuries (analyst view) —— Instant View: FOMC holds rates steady, markets rise modestly | Reuters · reuters.com · https://www.reuters.com/business/view-fomc-holds-rates-steady-markets-… Review: October 29, 2026 - Investrade · investrade.com · https://investrade.com/market-review-october-29-2026;Dollar Index (DXY) Slips 3 Sessions as Yields Drop After Fed Hold · vantagemarkets.com · https://www.vantagemarkets.com/market-analysis/why-dollar-index-fell-t… ④ NBS manufacturing PMI 49.3 (September 50.1) —— China's Factory Activity Returns to Contraction in October - The China-Global South Project · chinaglobalsouth.com · https://chinaglobalsouth.com/2026/10/31/china-manufacturing-pmi-octobe… ⑤ RatingDog manufacturing PMI 52.0 (September 52.1) —— China Manufacturing PMI Beats Estimates · tradingeconomics.com · https://tradingeconomics.com/china/manufacturing-pmi/news/597072 ⑥ BCOM 2027 weights: Energy 29.37%, Grains 20.61%, Precious Metals 19.49%, Industrial Metals 15.75%, Softs 8.84%, Livestock 5.94%; October nearly unchanged (analyst view) —— Bloomberg Commodity Index 2027 Target Weights Announced | Press | Bloomberg LP · bloomberg.com · https://www.bloomberg.com/company/press/bloomberg-commodity-index-2027… surges, precious metals tumble as 2026 rotation strengthens diversification case – Saxo Bank’s Hansen | Kitco News · kitco.com · https://www.kitco.com/news/article/2026-10-30/energy-surges-precious-m…
  14. 第 14 页:Outlook · Dates|Plan around Nov 3, Nov 4 and the December Fed

    第 14 页

    Outlook · Dates|Plan around Nov 3, Nov 4 and the December Fed

    讲稿

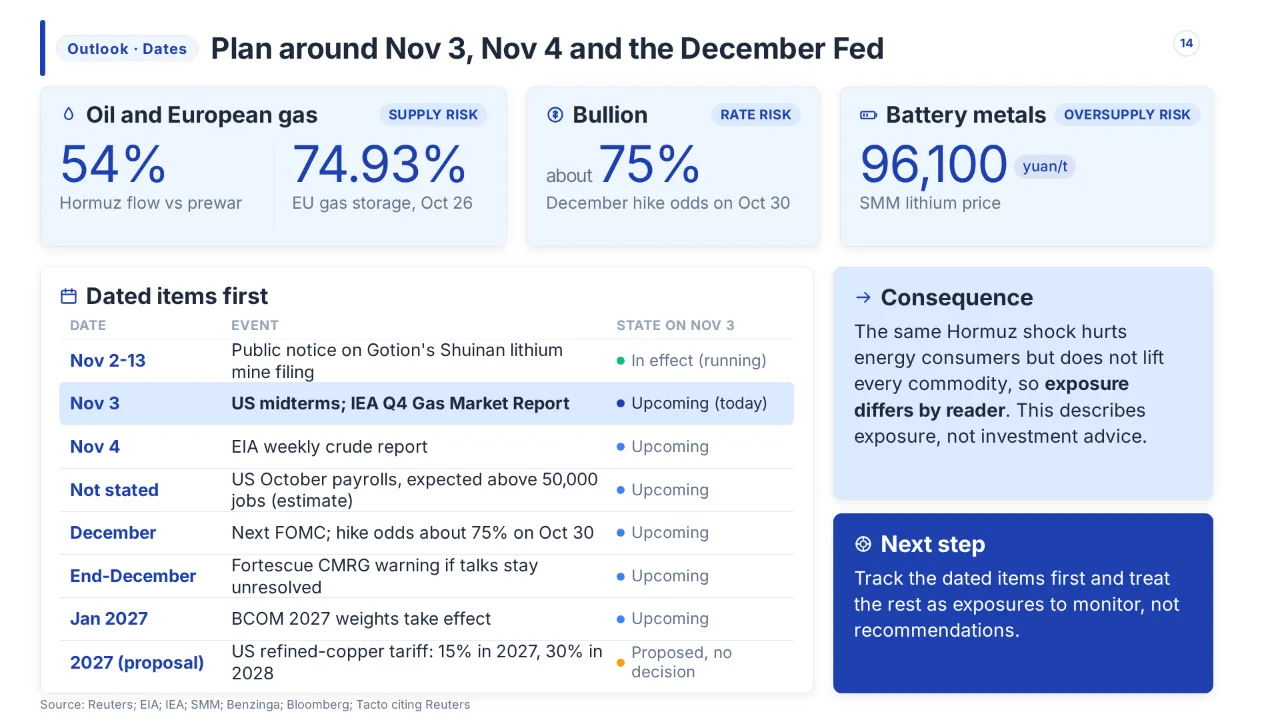
    With rates, supply and the macro picture covered, here is how to plan. The risks are asymmetric. Oil and European gas carry supply risk, with Hormuz flow at 54% of prewar and EU storage at 74.93%. Bullion carries rate risk, with December hike odds about 75% on October 30. Battery metals carry oversupply risk, with SMM lithium at 96,100 yuan a tonne. Track the dated items first: November 3 brings the US midterms and the IEA Q4 Gas Market Report, and November 4 the EIA weekly crude report. The US refined-copper tariff, 15% in 2027 and 30% in 2028, is only proposed. This describes exposure, not investment advice. That brings us to the close.

    页面文字

    Outlook · Dates

    Plan around Nov 3, Nov 4 and the December Fed

    Source: Reuters; EIA; IEA; SMM; Benzinga; Bloomberg; Tacto citing Reuters

    Oil and European gas

    SUPPLY RISK

    54%

    Hormuz flow vs prewar

    74.93%

    EU gas storage, Oct 26

    Bullion

    RATE RISK

    about 75%

    December hike odds on Oct 30

    Battery metals OVERSUPPLY RISK

    96,100 yuan/t

    SMM lithium price

    Dated items first

    DATE EVENT STATE ON NOV 3

    Nov 2-13 Public notice on Gotion's Shuinan lithium mine filing In effect (running)

    Nov 3 US midterms; IEA Q4 Gas Market Report Upcoming (today)

    Nov 4 EIA weekly crude report Upcoming

    Not stated US October payrolls, expected above 50,000 jobs (estimate) Upcoming

    December Next FOMC; hike odds about 75% on Oct 30 Upcoming

    End-December Fortescue CMRG warning if talks stay unresolved Upcoming

    Jan 2027 BCOM 2027 weights take effect Upcoming

    2027 (proposal) US refined-copper tariff: 15% in 2027, 30% in 2028 Proposed, no decision

    Consequence

    The same Hormuz shock hurts energy consumers but does not lift every commodity, so exposure differs by reader . This describes exposure, not investment advice.

    Next step

    Track the dated items first and treat the rest as exposures to monitor, not recommendations.

    数据出处
    【本页依据】 ① Hormuz oil flow 54% of prewar level —— Hormuz at 54% of Prewar Flows Inflates Brent, Capping WTI Downside - Article | Crux Investor · cruxinvestor.com · https://www.cruxinvestor.com/posts/hormuz-at-54-of-prewar-flows-inflat… set for fourth monthly gain as Hormuz tanker attack highlights supply risks | Reuters · reuters.com · https://www.reuters.com/business/energy/oil-rises-supply-concerns-hout… ② EU gas storage 74.93% on Oct 26 —— EU Gas Storage Trajectory — Fill Curve vs 5-Year Norm · global-energy-flow.com · https://global-energy-flow.com/storage/trajectory ③ December Fed hike odds about 75% on Oct 30 —— Gold slips as higher oil, US inflation data bolster Fed hike bets | Reuters · reuters.com · https://www.reuters.com/world/india/gold-slips-higher-oil-us-inflation… ④ SMM lithium 96,100 yuan/t —— [SMM Analysis] Lithium carbonate prices plunge this week, destocking slows down - Shanghai Metals Market (SMM) · news.metal.com · https://news.metal.com/newscontent/104186365-smm-analysis-lithium-carb… ⑤ Nov 3 US midterms and IEA Q4 Gas Market Report; Nov 4 EIA weekly crude report —— Oil set for fourth monthly gain as Hormuz tanker attack highlights supply risks | Reuters · reuters.com · https://www.reuters.com/business/energy/oil-rises-supply-concerns-hout… Pump Monitor 2026: Webinar (afternoon session) - Event - IEA · iea.org · https://www.iea.org/events/heat-pump-monitor-2026-webinar-afternoon-se… Petroleum Status Report - U.S. Energy Information Administration (EIA) · eia.gov · https://www.eia.gov/petroleum/supply/weekly?monitor_asof=20261029_034240 ⑥ US refined-copper tariff 15% in 2027 and 30% in 2028 proposed, no decision; Fortescue CMRG warning at end-December —— Copper Price Today: Price, Trends & Forecast 2026 | Tacto · tacto.ai · https://www.tacto.ai/en/commodities/copper-price;Fortescue's Iron Ore Sales Trail Shipments by 3.9 Million Tonnes — What Happens Next? · linkedin.com · https://www.linkedin.com/pulse/fortescues-iron-ore-sales-trail-shipmen…
  15. 第 15 页:Rates for bullion, supply for battery metals

    第 15 页

    Rates for bullion, supply for battery metals

    讲稿

    Oil held its war premium, but rates pushed gold and silver down and supply pushed lithium and cobalt down. Rates for bullion, supply for battery metals. Thank you for your time.

    页面文字

    Closing

    Oil held its war premium, but rates pushed gold and

    silver down and supply pushed lithium and cobalt down.

    Thank you

    2026-11-03 · Commodities Biweekly Brief · Oct 24–Nov 2, 2026

信息来源(147)

链接指向 Divrite 调研时找到并引用的原始页面。

  1. 01Brent ends October up 13.6% as Iran war risks unsettle marketsnationthailand.com
  2. 02Oil set for fourth monthly gain as Hormuz tanker attack highlights supply risks | Reutersreuters.com
  3. 03Oil prices set for fourth straight monthly gains as tanker attack highlights supply risks | livelive.euronext.com
  4. 04Oil set for fourth monthly gain as Hormuz tanker attack highlights supply risks - Markets - Business Recorderbrecorder.com
  5. 05Duncan Oil - At 5:30 a.m. EDT on October 30, 2026, U.S....facebook.com
  6. 06Oil prices set for sharp monthly rise on Hormuz strikes and US threat to hit Iran | The Nationalthenationalnews.com
  7. 07Organization of the Petroleum Exporting Countriesopec.org
  8. 08Weekly Petroleum Status Report - U.S. Energy Information Administration (EIA)eia.gov
  9. 09Weekly Petroleum Status Report - U.S. Energy Information Administration (EIA)eia.gov
  10. 10Weekly Petroleum Status Report - U.S. Energy Information Administration (EIA)eia.gov
  11. 11Weekly Petroleum Status Report - U.S. Energy Information Administration (EIA)eia.gov
  12. 12Weekly U.S. Ending Stocks of Crude Oil in SPR (Thousand Barrels)eia.gov
展开其余 135 条来源
  1. 13U.S. Energy Information Administration - EIA - Independent Statistics and Analysiseia.gov
  2. 14Hormuz at 54% of Prewar Flows Inflates Brent, Capping WTI Downside - Article | Crux Investorcruxinvestor.com
  3. 15US Iran War Oil Prices: How Escalating Geopolitical Risk Is Reshaping Global Energy Markets 28-10-2026polyestertime.com
  4. 16Oil Prices Fall After Weekend Rally, Diplomacy and Security Tensions Loom | CORNERSTONE FUTURES LLC posted on the topic | LinkedInlinkedin.com
  5. 17Strait of Hormuz Ship Diversions Today Oct 2026kingdomexploration.com
  6. 18Iran War: Weekly Energy Market Update & Impacts | Breakthroughbreakthroughfuel.com
  7. 19Week in Review - Middle East Disruptions Push Oil Forecasts Higher While Demand Weakens - Mansfield Energymansfield.energy
  8. 20UBS raises Brent outlook, sees oil at $110/bbl by end-2026 | Reutersreuters.com
  9. 21Record Tanker Rates Cripple U.S. Crude Oil Flows to Asia | OilPrice.comoilprice.com
  10. 22Natural gas prices weekly update – JKM, TTF and Henry Hub (26 October 2026) | Global LNG Hubgloballnghub.com
  11. 23Australian gas supply outlook hinges on LNG exporters’ uncontracted volumes | Global LNG Hubgloballnghub.com
  12. 24Queensland LNG exports hit a Q3 record as domestic gas demand retreats | Global LNG Hubgloballnghub.com
  13. 25UK gas winter outlook highlights growing reliance on LNG | Global LNG Hubgloballnghub.com
  14. 26How seven months of Middle East conflict have reshaped the LNG market outlook | Global LNG Hubgloballnghub.com
  15. 27LNG projects | Global LNG Hubgloballnghub.com
  16. 28Natural Gas Prices Fall 5.6% to 2.64/MMBtu | Premier Energy Management LLC posted on the topic | LinkedInlinkedin.com
  17. 29Natural Gas Nov '26 Futures Price - Barchart.combarchart.com
  18. 30Wall Street Is Betting Big Against Natural Gas as a Mild Winter Loomsfinance.yahoo.com
  19. 31Natural Gas Price Forecast 2026–2027: Henry Hub and TTF Outlook | MarketScreenermarketscreener.com
  20. 32Natural Gas Futures Price Today – Live MCX Rate | INDmoneyindmoney.com
  21. 33Weekly Natural Gas Storage Reportir.eia.gov
  22. 34Mississippi Natural Gas in Underground Storage (Working Gas) (Million Cubic Feet)eia.gov
  23. 35Weekly Working Gas in Underground Storageeia.gov
  24. 36U.S. Energy Information Administration - EIA - Independent Statistics and Analysiseia.gov
  25. 37U.S. Energy Information Administration - EIA - Independent Statistics and Analysiseia.gov
  26. 38Low European Storage Levels Signal Potential LNG Volatility, BP Saysnaturalgasintel.com
  27. 39EU Gas Storage Levels Today — Live AGSI+ Tracker | GEFglobal-energy-flow.com
  28. 40European gas storage at record low, Dutch TTF gas price surges | Discovery Alert posted on the topic | LinkedInlinkedin.com
  29. 41ENTSOG WINTER SUPPLY OUTLOOK 2026/2027entsog.eu
  30. 42European gas markets - Summer 2026 - acer.europa.euacer.europa.eu
  31. 43EU Gas Storage Trajectory — Fill Curve vs 5-Year Normglobal-energy-flow.com
  32. 44Global Gas Security Review and Q4 Gas Market Report - Event - IEAiea.org
  33. 45Heat Pump Monitor 2026: Webinar (afternoon session) - Event - IEAiea.org
  34. 46Modernising grids in the age of electricity - Event - IEAiea.org
  35. 47IEA EGRD Workshop: Scaling battery Eecosystems - Evaluating R,D & E priorities to overcome gigafactory build-out bottlenecks - Event - IEAiea.org
  36. 4820th Energy Efficiency Policy Training Week - Event - IEAiea.org
  37. 49RETA Global Roundtable and IEA Secure Electricity Systems Workshop - Event - IEAiea.org
  38. 50Gold & Silver Return to 2025 Lows After Record Highssdbullion.com
  39. 51Gold and silver slid to fresh lows (Oct 30, 2026)bulliontradingllc.com
  40. 52Overnight Summary - Precious Metals Prices 30/10/2026guardian-gold.com.au
  41. 53Gold price today, Friday, October 30, 2026: Gold slips below $4,000 as Mid-East concerns mountfinance.yahoo.com
  42. 54Gold Price Today and Since 1960, With Every 20% Decline | thetrading.toolsthetrading.tools
  43. 55Current price of gold: October 30, 2026 | Fortunefortune.com
  44. 56Gold slips on higher oil; markets assess Warsh comments after Fed holds rates steady | Reutersreuters.com
  45. 57Fed rate decision live: FOMC holds rates steady after September hike | Reutersreuters.com
  46. 58Gold slips as higher oil, US inflation data bolster Fed hike bets | Reutersreuters.com
  47. 59Gold gains on softer oil prices ahead of Fed meeting | Reutersreuters.com
  48. 60Instant View: FOMC holds rates steady, markets rise modestly | Reutersreuters.com
  49. 61Gold ETF: Stock, Holdings and Flows | World Gold Councilgold.org
  50. 62Weekly Markets Monitorgold.org
  51. 63Gold Research Report Library | Goldhub | World Gold Councilgold.org
  52. 64Gold Demand Trends | World Gold Councilgold.org
  53. 65GLD Suffers $1.8 Billion October Outflow, Its Worst Since June | 24/7 Wall St.247wallst.com
  54. 66Gold ETF Flows: Money Moving Into and Out of GLD, IAU and US Gold ETFs | thetrading.toolsthetrading.tools
  55. 67A second chance to invest in goldvaneck.com.au
  56. 68Commodity ETFs: Beyond the Gold Trade | ETF Trendsetftrends.com
  57. 69Gold Price Drops Below Key Support as GLD ETF Outflows Jump as NFP Loom - SPDR Gold Shares (ARCA:GLD),…benzinga.com
  58. 70Oil Rallies While Gold ETFs See Heavy Outflows - ETF Actionetfaction.com
  59. 71POLL Strong dollar, high yields drag on gold outlook, but central-bank demand lends support | Reutersreuters.com
  60. 72Gold Price Prediction 2026: Where Will Gold Land After the Historic Correction?mitrade.com
  61. 73Gold heads for its biggest yearly drop in 11 years as the Iran war lifts yields and the dollarinvestinglive.com
  62. 74Strong dollar, high yields drag on gold outlook, but central-bank demand lends supportground.news
  63. 75Gold Price Forecast for 2026 Cut for Second Straight Quarter; Analysts Still See Rebound to $4,650 in 2027 — BigGo Financefinance.biggo.com
  64. 76Inventory destocking continues, coupled with tight supply, driving Shanghai spot copper premiums gradually higher [SMM SHFE Copper Spot Weekly Review] - Shanghai Metals Market (SMM)news.metal.com
  65. 77US economic resilience strengthens rate hike expectations, copper prices consolidate under pressure [SMM Copper Morning Meeting Summary] - Shanghai Metals Market (SMM)news.metal.com
  66. 78Supply deficit continues to intensify, Yangshan copper premiums hit a historic high [SMM Yangshan Copper Weekly Review] - Shanghai Metals Market (SMM)news.metal.com
  67. 79Tax-inclusive supply "cleared within 1-2 days"; invoices and invoice tax rates choke off volume growth [SMM Copper Scrap Weekly Review] - Shanghai Metals Market (SMM)news.metal.com
  68. 80Copper Insight – 29 October 2026 Editionlmeinsight.com
  69. 81Codelco, BHP Sign $40m Exploration Agreement for Chile’s Anillo Copper Projectlmeinsight.com
  70. 82Capstone Targets Doubling of Chilean Copper Output by 2031 in $3bn Expansionlmeinsight.com
  71. 83Constellium Raises 2026 Guidance After Record Third-Quarter EBITDAlmeinsight.com
  72. 84Aluminium Insight Weekly – 29 October 2026 Editionlmeinsight.com
  73. 85The LME Weekly Review: 19-23 October 2026lmeinsight.com
  74. 86Copper Prices in 2026: Will Mine Shortages Sustain the AI-Driven Rally? • Carbon Creditscarboncredits.com
  75. 87Copper Price Today: Price, Trends & Forecast 2026 | Tactotacto.ai
  76. 88Copper Prices 2016–2026: Who Uses It and Why Prices Are Risingojmetalrecycling.co.uk
  77. 89Copper price set for first monthly loss since June as AI spending worries weigh - MINING.COMmining.com
  78. 90TECK Q3 2026 News Releaseteck.com
  79. 91LME Zinc Stocks (Oct 27, 2026): 165.7K mt, Up 36.2% in 30 Daysthevaultreport.com
  80. 92Copper Retreats to $14,310 as China Stocks Drop 27%minelistings.com
  81. 93Zinc price hits two-week high as tight stocks spur bullish sentiment - Mining.com.aumining.com.au
  82. 94China Is Importing More Iron Ore While Producing Less Steel. Is Global Pricing Power Shifting?linkedin.com
  83. 95Fortescue's Iron Ore Sales Trail Shipments by 3.9 Million Tonnes — What Happens Next?linkedin.com
  84. 96Latest Analysis about China Steel & Commodities Market | Mysteelmysteel.net
  85. 97Iron-Ore Prices Rise After Sharp Declines as Chinese Demand Holds Up - News and Statistics - IndexBoxindexbox.io
  86. 98Iron ore prices remained under pressure in the second half of Octobergmk.center
  87. 99[SMM Analysis] Lithium carbonate prices plunge this week, destocking slows down - Shanghai Metals Market (SMM)news.metal.com
  88. 100[SMM Lithium Carbonate Daily Review] On October 26, spot lithium carbonate stopped falling and rebounded, ending its previous consecutive decline. - Shanghai Metals Market (SMM)news.metal.com
  89. 101[SMM Lithium Carbonate Daily Review] On October 26, spot lithium carbonate stopped falling and rebounded, ending its previous consecutive decline. - Shanghai Metals Market (SMM)news.metal.com
  90. 102[SMM Lithium Carbonate Daily Review] Lithium Carbonate Futures and Spot Prices Rebound in Tandem on October 27 - Shanghai Metals Market (SMM)news.metal.com
  91. 103[SMM Lithium Carbonate Daily Review] On October 28, spot lithium carbonate prices rose by 700 yuan/mt, while futures retreated after a rapid rise, falling on increased volume and open interest. - Shanghai Metals Market (SMM)news.metal.com
  92. 104[SMM Lithium Carbonate Daily Review] On October 28, spot lithium carbonate prices rose by 700 yuan/mt, while futures retreated after a rapid rise, falling on increased volume and open interest. - Shanghai Metals Market (SMM)news.metal.com
  93. 105lc2701, GFEX Main Continuous Contract Price Futures Price, Futures Prices of Guangzhou Futures Exchange - Shanghai Metals Market (SMM)metal.com
  94. 106solid operational momentum in Q3 and progress on the funding planeramet.com
  95. 107Eramet: solid operational momentum in Q3 and progress onglobenewswire.com
  96. 108Battery Materials & Futures Market Insights Forum Tickets, Thursday, October 29  •  2:30 AM - 7:30 AM | Eventbriteeventbrite.com
  97. 109Lithium, cobalt markets cautious on China’s demand – MineralPrices.commineralprices.com
  98. 110Eramet: solid operational momentum in Q3 and progress onglobenewswire.com
  99. 111Eramet : bonne dynamique opérationnelle au T3 et avancée duglobenewswire.com
  100. 112Q3 2026 Trading Updateglobenewswire.com
  101. 113Festi hf.: Presentation of Q3 2026 resultsglobenewswire.com
  102. 114Lithium-Ion Battery Recycling Market Report 2026: Globalglobenewswire.com
  103. 115Nickel producers weigh 50% Indonesian cuts as prices hit 10-month low - The Oregon Grouptheoregongroup.com
  104. 116China Giants Poised to Halve Nickel Production in Morowali | IDNFinancialsidnfinancials.com
  105. 117LME nickel prices rebound on Indonesian production cut rumors while surplus outlook remains-Yieh Corp Steel Newsyieh.com
  106. 118[SMM Nickel Ore Market Weekly Review] Indonesia's Benchmark Price Cut and Weak Demand Put Regional Nickel Ore Prices Under Pressure - Shanghai Metals Market (SMM)news.metal.com
  107. 119Glencore's cobalt output falls 52% in nine months under Congo quotas - The Oregon Grouptheoregongroup.com
  108. 120Glencore's Copper Output Jumps 37% in DR Congo, While Cobalt Production Falls 56% - BANKABLEbankable.africa
  109. 121Glencore cobalt output sinks 52% under DRC quotas - MINING.COMmining.com
  110. 122Who Runs DR Congo's Economy, the Key Players in 2026 | The Rio Timesriotimesonline.com
  111. 123Glencore's Cobalt Output Halves as Copper and Ferrochrome Push Backad-hoc-news.de
  112. 124Federal Reserve issues FOMC statementfederalreserve.gov
  113. 125Transcript of Chairman Warsh's Press Conference, October ...federalreserve.gov
  114. 126Federal Reserve Board - Federal Reserve issues FOMC statementfederalreserve.gov
  115. 127Federal Reserve Board - Federal Reserve issues FOMC statementfederalreserve.gov
  116. 128Federal Reserve Board - Federal Reserve issues FOMC statementfederalreserve.gov
  117. 129Federal Reserve Board - Federal Reserve issues FOMC statementfederalreserve.gov
  118. 130Market Review: October 29, 2026 - Investradeinvestrade.com
  119. 131US Gross Domestic Product: 3rd Quarter 2026 · Advance estimate — Thursday, 29 October 2026 | Finance Calendarfinancecalendar.com
  120. 132Fed’s preferred inflation gauge rose in September as third-quarter GDP beats expectationsfoxbusiness.com
  121. 133Dollar Index (DXY) Slips 3 Sessions as Yields Drop After Fed Holdvantagemarkets.com
  122. 134U.S. GDP Accelerates to 3.4% in Q3 2026 as Consumer Spending & Inflation Pressures Persistlinkedin.com
  123. 135🏦 Fed Holds. What's next for the dollar & gold? | October 29, 2026 (Thursday) The Fed kept rates at 3.75%-4.00%. Growth is strong, but inflation remains elevated. 📌 Market Reaction: 🔻 U.S. Dollar Index: Weakened following the Fed’s decision 🟡 Gold: Consolidated after the Fed’s decision as markets continued to assess the interest rate outlook 🛢️ WTI Crude Oil: Prices Remain Firm as Energy Inflation Concerns Persist 📍 What about gold? High Treasury yields + rate hike bets may cap the upside, but Middle East tensions could still support safe-haven demand. 📅 What's next: inflation data, oil prices, Fed policy Follow us for more: https://fortuneprime.com/ CFDs Trading is risky. Plese ensure you fully understand the risks involved before engaging in any transactions with us. #Fed #FOMC #RateDecision #Gold #USD #DXY #Oil #WTI #Inflation #Treasury #Forex #Trading #Markets #FPG #FortunePrimeGlobal #FPGFortunePrimeGlobal | FPG Fortune Prime Globalfacebook.com
  124. 136China Manufacturing PMI Beats Estimatestradingeconomics.com
  125. 137China's Factory Activity Returns to Contraction in October - The China-Global South Projectchinaglobalsouth.com
  126. 138China's October 2026 PMI: all three headline indices slip below 50 | Fistotexfistotex.com
  127. 139China factory output grows at fastest pace in 6 months: RatingDog PMIau.finance.yahoo.com
  128. 140Energy surges, precious metals tumble as 2026 rotation strengthens diversification case – Saxo Bank’s Hansen | Kitco Newskitco.com
  129. 141Saxo Bank's Ole Hansen: 2026 Commodity Rotation Makes Case for Diversification - News and Statistics - IndexBoxindexbox.io
  130. 142Invesco's Commodity DIGESTinvesco.com
  131. 143Bloomberg Commodity Index 2027 Target Weights Announced | Press | Bloomberg LPbloomberg.com
  132. 144Bloomberg Commodity Index 2027 Target Weights Announced | Press | Bloomberg LPbloomberg.com
  133. 145BERY:IND | Bloomberg Enhanced Roll Yield Excess Return Index | Indices | Bloomberg Professional Servicesbloomberg.com
  134. 146Aurora Expects to Meet 2027 Truck Target After Missing 2026 Production Goals - Bloombergbloomberg.com
  135. 147Aurora Expects to Meet 2027 Truck Target After Missing 2026 Production Goals - Bloombergbloomberg.com
目录
  1. 011. Key takeaways from the window
  2. 022. Energy: oil and OPEC+
  3. 033. Energy: natural gas and LNG
  4. 044. Precious metals
  5. 055. Industrial metals
  6. 066. Battery metals
  7. 077. Macro drivers and demand
  8. 088. Supply and demand risks and what to watch
  9. 099. References

1. Key takeaways from the window

Between Oct 24 and Nov 2, 2026, commodity prices were set by the Hormuz shock in oil, by a Fed that held rates but kept hikes on the table, and by supply pressure in lithium and cobalt. Five conclusions explain the window; each is supported in the chapters named in brackets, with every fact judged against Nov 3.

Cover visual of the Commodities biweekly brief.

1. Oil held its war premium, but the window itself was flat. December Brent settled at $117.64 on Oct 30 and WTI at $104.12, after October gains of 13.6% and 15.2%. Against a derived Oct 23 base of about $116.72 the window change is only about +0.8%. A tanker was hit by explosive devices in Hormuz on Oct 30, while flow there was still 54% of prewar. OPEC+ met on Nov 1, but the December decision is not in the material; analysts expected unchanged targets (press report). UBS raised its end-2026 Brent estimate to $110 from $100 (estimate), and put Middle East-to-China tanker freight at $30-$40/bbl. [Chapter 2]

2. Gas split in two: cheap in the US, on crisis pricing in Europe and Asia. Henry Hub November settled at $2.602 on Oct 26, its lowest since Apr 28, against the largest speculative net short since Feb 11, 2020, 241,272 contracts as of Oct 20. TTF and JKM were above $30/MBtu at the last JOGMEC prints on Oct 23, and EU storage sat 16.6 points below the five-year average (context). EU storage was 74.93% on Oct 26, up only 0.33 points in three days; reaching 80% would need 0.84 points a day. The IEA's Q4 gas report is due Nov 3. [Chapter 3]

3. Gold and silver broke lower despite the war, because rates mattered more. Gold fell about 3.2% from the LBMA PM price of $4,013.3 on Oct 23 to a COMEX settle of $3,885 on Oct 30, with other closes at $3,875-$3,877; silver fell about 8.9% to $49.12. The Fed held at 3.75-4.00% on Oct 28 by 10-2, with two votes for a hike, and CME FedWatch put a December hike at 86% that day and about 75% on Oct 30. A Reuters poll (estimate) cut the 2026 gold median to $4,495. [Chapters 4 and 7]

4. Copper's screen price eased while China's physical market tightened; lithium and cobalt fell on supply. LME copper was $14,140 on Oct 30 (intraday), 1.27% under the Oct 23 close, and October was heading for a 1.8% fall. Yet the SHFE spot premium rose from 850 to 1,140 yuan/t and Shanghai plus Jiangsu stocks fell 14,400 t to 57,900 t. SMM lithium carbonate averaged 96,100 yuan/t on Oct 29, and GFEX LC2701 closed 8.4% lower on the day. Glencore's own-sourced cobalt fell 52% in January-September to 13,700 t because of Congo's quotas, while Indonesian nickel cuts stayed unconfirmed by any producer. [Chapters 5 and 6]

5. Rates, not growth, drove the macro tape. US Q3 GDP grew 3.4% and September PCE ran at 3.6% y/y, yet the 10-year yield eased from 5.042% intraday on Oct 28 to about 4.93% on Oct 30. China's official manufacturing PMI slipped to 49.3 while the RatingDog survey held at 52.0. Saxo (analyst view) saw the Bloomberg Commodity Index nearly unchanged in October, and Bloomberg's 2027 weights put Energy at 29.37%. [Chapter 7]

1.1 Prices at a glance

Levels mix settles, intraday quotes and averages; each row keeps its own benchmark and date, and "derived" means our arithmetic from the cited chapter.

Commodity Level Change over the window Date Main driver Source
Brent Dec futures, USD/bbl $117.64 settle About +0.8% vs derived Oct 23 base of $116.72 (derived) Oct 30 Hormuz attacks, Qatari mediation, midterm risk The Nation; broker note
WTI futures, USD/bbl $104.12 settle +$0.85, +0.8% vs derived $103.27 (derived) Oct 30 Same as Brent The Nation; broker note
Henry Hub November, USD/MMBtu $2.602 settle (consultant post, not CME) -1.44% vs $2.64 on Oct 23 Oct 26 Warm forecasts, heavy output, crowded short Premier Energy Management
EU gas storage, % full 74.93% +0.33 points in three days (from 74.6% on Oct 23) Oct 26 Constrained LNG, Hormuz risk AGSI+ via Global LNG Hub; GEF
Gold, USD/oz $3,885 COMEX front-month settle About -3.2% vs LBMA PM $4,013.3 on Oct 23 (mixed benchmarks) Oct 30 Fed hold with hike odds, oil-driven inflation thetrading.tools; WGC
Silver, USD/oz $49.12 spot close -8.9% vs $53.9 on Oct 23 Oct 30 Yields, crowded positioning (analyst view) Bullion Trading; WGC
LME copper 3M, USD/t $14,140 (17:20 GMT) -1.27% vs $14,322.50 close on Oct 23 (intraday vs close) Oct 30 AI-spending worries, higher oil; tight SHFE spot Reuters via Mining.com; LME Insight
SMM lithium carbonate, yuan/t 96,100 average spot -0.93% (-900) vs 97,000 on Oct 23 Oct 29 Rising Chinese output, order cuts SMM
Iron ore 61% fines, USD/dmt CFR Qingdao $91.05 +0.77% on the day; no window change (indices differ) Nov 2 Weak steel demand, ample supply Mysteel

2. Energy: oil and OPEC+

Chapter 1 gives the cross-market takeaways; oil is where the window's main shock sits, because the Hormuz war premium on Brent feeds the inflation and rates story that moves the metals in Chapters 4 and 7.

2.1 Oil snapshot

Prices are futures settles unless marked. Brent December expired on Oct 30, so January is now the active contract. "Derived" means our arithmetic on a reported change, not a published settle.

Item Key figure Date Status Source
Brent Dec futures, settle $117.64/bbl (+$2.76, +2.4%); intraday high $118 Oct 30 reported The Nation
Brent Jan (active) futures, settle $113.43/bbl (+$2.63) Oct 30 reported The Nation
WTI futures, settle $104.12/bbl (+$2.12, +2.08%) Oct 30 reported The Nation
October change, Brent / WTI +13.6% / +15.2% Oct 30 reported The Nation
Brent Dec / WTI, prior-day settle $114.88 / $102.00 Oct 29 derived The Nation
US commercial crude stocks 410.6 mn bbl (-1.9 w/w, -5.3 y/y) week to Oct 23 (released Oct 28) reported EIA
OPEC+ seven-country meeting held virtually; outcome text not in material Nov 1 decision (meeting confirmed) OPEC
Hormuz oil flows 9.34 mb/d, 54% of 17.15 mb/d prewar seven days to about Oct 27 reported (secondary) Crux Investor
UBS Brent, end-2026 $110/bbl (from $100) Oct 28 estimate Reuters
Reuters poll, Brent 2026 average $92.88/bbl (from $89.05) October estimate Mansfield

2.2 Prices: a flat window after a 13.6% month

Brent and WTI ended the window almost where it began (about +0.8%), but October as a whole was +13.6% and +15.2%: most of the gain was banked by Oct 23, and the window was spent defending it against Hormuz attacks, mediation and midterm risk.

On Oct 30 December Brent settled at $117.64, up $2.76 (+2.4%) after touching $118, and WTI at $104.12, up $2.12. Both were the highest settlements since the end of April. Subtracting the day's gains gives Oct 29 settles of $114.88 (117.64 - 2.76) and $102.00 (104.12 - 2.12); Mansfield also records WTI down $0.78 that day.

There is no published Oct 23 settle in the material, so the baseline is derived. A broker note (discovery only) put December Brent at $114.52 on the morning of Oct 26, down $2.20, and WTI at $100.83, down $2.44. That implies Oct 23 closes of about $116.72 and $103.27. The National's Oct 30 weekly gain of 0.64% at $117.56 implies about $116.81. On that base the window change is about +$0.8 to +$0.9 for Brent (+0.7% to +0.8%): 117.64 - 116.72 = 0.92, and 0.92 / 116.72 = 0.8%. WTI: 104.12 - 103.27 = +$0.85 (+0.8%). The last observation in the material is Oct 30; there is no Nov 2 quote.

Between those points the path was choppy. Brent fell on Oct 26 (broker note), recovered to $116.85 intraday on Oct 27 after Tehran talks (Crux, intraday), and climbed above $115 on Oct 28 after an attack on a Saudi refinery (Reuters).

October gains differ by source: Reuters pre-close had 13% and 15%, The National about 15% and 12% intraday. We follow the post-settlement 13.6% and 15.2%. That implies Sep 30 levels near $103.56 for Brent (117.64 / 1.136) and $90.38 for WTI (104.12 / 1.152); our arithmetic.

Spreads matter. Dec Brent minus WTI was $13.52 on Oct 30 (117.64 - 104.12), but January minus WTI only $9.31 (113.43 - 104.12). The $4.21 Dec-Jan gap (117.64 - 113.43) is backwardation, which fits Mansfield's note of strong premiums for prompt cargoes. UBS says Middle East-to-China VLCC freight has jumped to $30-$40/bbl from $1-$3 over the past decade.

2.3 Hormuz attacks and the US-Iran fork around the midterms

On Oct 30 the UKMTO reported a tanker in the Strait of Hormuz hit by explosive devices attached from a small boat; responsibility was unclear. Maritime sources told Reuters it was the first known successful limpet-mine strike there since the war began in February. Iran's Revolutionary Guard instead said a tanker hit a naval mine on an "unauthorised route". Mansfield dates two tanker attacks to Oct 29; we follow the Reuters and UKMTO date of Oct 30. According to Kingdom Exploration (a company blog relaying Breakingthenews), a supertanker hit a mine east of Hormuz on Oct 31 and CENTCOM rerouted 144 ships; unconfirmed.

Houthi militants said on Oct 29 they attacked Ras Tanura, Rabigh and Abqaiq; a Saudi-led coalition said it intercepted a cruise missile. The US embassy in Riyadh said on Oct 30 that non-emergency staff were ordered out, effective Oct 23.

Physical flows are lower but not collapsing. Crux puts Hormuz oil flow at 9.34 mb/d, 54% of the 17.15 mb/d prewar level (9.34 / 17.15), while non-Iranian Middle East crude exports averaged 16.7 mb/d in October against 16.3 prewar. Mansfield cites about 10 mb/d. So the premium reflects risk, freight and thin product stocks more than lost barrels (analyst view). UBS notes October saw a record number of reported attacks on vessels, while Gulf port loadings stay below pre-conflict levels.

Diplomacy is unresolved. Qatari mediators returned to Tehran on Oct 30; Iran's Tasnim said it received a letter from Vice President Vance but had not replied and wants its conditions met. Trump was briefed on military options on Oct 29. Saxo's Ole Hansen said some investors expect US attacks to resume after the midterms on Nov 3, and Saxo expects higher volatility around the US and Israeli elections (analyst view, Oct 29). The election result is not in the material.

2.4 OPEC+, US stocks and forecasts

OPEC+. OPEC's release says seven countries (Saudi Arabia, Russia, Iraq, Kuwait, Kazakhstan, Algeria, Oman) met virtually on Nov 1 to review the market; the extract is cut off before the decision. Before the meeting, Mansfield reported (Oct 30) that analysts expected December targets unchanged, with limited adjustments until the Middle East is clearer. The unchanged outcome is therefore an expectation, not a confirmed decision, in this material.

EIA weekly report (week to Oct 23, released Oct 28). Commercial crude fell 1.892 mn bbl to 410.625 mn bbl (412.517 - 410.625), and sat 5.341 mn bbl (1.3%) below a year earlier (415.966). PADD 3 fell 1.542 mn and PADD 5 fell 1.495 mn, while PADD 4 rose 1.419 mn. Product stocks, refinery utilisation and SPR are not in the extract. The next report is due Nov 4 (upcoming).

Forecasts (all estimates). UBS raised Brent to $110 by end-2026 (from $100), and to $95, $90 and $85 for March, June and September 2027 (from $90, $85, $80). A Reuters poll in October has Brent averaging $92.88 in 2026, up $3.83 from $89.05, and WTI $86.60, up $2.70 from $83.90. Saxo sees $70-$90 after the conflict, against $60-$70 prewar. Context: EIA's October outlook (Oct 6) put Q4 Brent at $104.69 and 2027 at $83.74; Brent at $116.85 on Oct 27 was $12.16 above the Q4 figure (116.85 - 104.69), per Crux.

3. Energy: natural gas and LNG

Chapter 2 followed the Hormuz risk through crude oil; the same disruption reaches gas through LNG, but the three regional benchmarks reacted very differently.

Gas split in two. US Henry Hub kept falling on warm weather and heavy positioning against it, reaching its lowest settlement since April 28 on Oct 26 (reported by a consultant, not verified against CME). Europe and Asia stayed priced for crisis, with TTF and JKM above USD 30/MBtu at the last JOGMEC prints on Oct 23, and Europe enters winter 16.6 points below its five-year-average storage level (AGSI+).

3.1 Gas at a glance

Units: Henry Hub in USD per MMBtu (futures settle); TTF and JKM in USD per MBtu as assessed by JOGMEC; storage in % of working capacity or Bcf.

Item Key figure Date Status Source
Henry Hub Nov futures 2.6 (3.1 a week earlier) Oct 23 Reported, context JOGMEC via Global LNG Hub
Henry Hub Nov settle 2.64, then 2.602 (−1.44%) Oct 23, Oct 26 Reported (consultant post, not CME) Premier Energy Management
Henry Hub Dec futures about 3.05 (from 3.386) Oct 23 Reported, context Yahoo Finance
EIA US storage 3,644 Bcf, +77 Bcf Week to Oct 16 (released Oct 22) Reported, context EIA
EIA US storage, week to Oct 23 Not in material Release due Oct 29 Gap EIA
JKM (Dec delivery) high-31s Oct 23 Reported, context JOGMEC via Global LNG Hub
TTF (Nov delivery) 30.8 (28.9 a week earlier) Oct 23 Reported, context JOGMEC via Global LNG Hub
EU storage 74.6%; 74.93% Oct 23; gas day Oct 26 Reported AGSI+ via Global LNG Hub; GEF
IEA Q4 Gas Market Report Launch scheduled Nov 3 Upcoming IEA

3.2 Henry Hub: weather and positioning

The last observation before the window is the Oct 23 fall. November gas settled at $3.116 on Oct 16 and about $2.64 on Oct 23, so (2.64 − 3.116) ÷ 3.116 = −15.3%; JOGMEC puts it at 3.1 to 2.6. December, the next front month, slipped from $3.386 to about $3.05.

Inside the window the material is thin. According to Premier Energy Management, an energy-procurement consultancy whose LinkedIn post is a lead rather than a primary source, the November contract settled at $2.602 on Oct 26, down 3.8 cents, its lowest since April 28, with expiry on Oct 28. Window change: (2.602 − 2.64) ÷ 2.64 = −1.44% (reported, same source). The Oct 27 and Oct 28 settles are not in the material. Undated price-ticker widgets show front-month gas near 2.88 to 2.93, which we do not use as figures.

The drivers named are weather and supply: warm forecasts, adequate storage, heavy production and no tropical threat (consultant view). Yahoo Finance reports that the government's winter outlook expects a very strong El Niño to bring warmth across the northern US, and that short-range maps gave 70% to 80% odds of above-normal warmth in the Southeast for Oct 29 to Nov 2 (forecast, no issuing date stated).

Positioning is extreme. In CFTC data as of Oct 20 (released Oct 23), speculators held 505,747 short and 264,475 long contracts: a net short of 241,272, the largest since Feb 11, 2020. Yahoo says this "fell" from 233,578, but 241,272 − 233,578 = +7,694, so it rose; we follow the arithmetic. Hedge-fund net short rose from 126,481 to 157,409, up 30,928. On storage, the EIA's Oct 22 report put working gas at 3,644 Bcf, +77 Bcf against 79 expected and 86 a year earlier; stocks were 152 Bcf (4.0%) below last year and 35 Bcf (1.0%) above the five-year average. EIA scheduled the next report for Oct 29, but its figures are not in the material.

3.3 Europe: low storage, high prices

JOGMEC's weekly data show TTF rising from USD 28.9 to 30.8 per MBtu between Oct 16 and Oct 23, +6.6% (1.9 ÷ 28.9), after dipping below 28 on Oct 20 on mediation reports; Troll and Asgard outages and colder forecasts did the rest. These are context prints; no in-window TTF settle is in the material. A LinkedIn summary puts TTF near EUR 97.50/MWh and an OilPrice headline says European gas topped EUR 101 for the first time since 2022; neither is dated, and EUR/MWh cannot be compared with USD/MBtu without an exchange rate.

Storage is the stronger evidence. The EU regulator ACER, in its report of Oct 27, says EU stocks reached 75% by Oct 21 after entering summer at 28% against a nine-year average of about 40%. Net injections were about 43 bcm against a ten-year average of 47 bcm (−4 bcm, −8.5%), and the injection bill was about EUR 27 billion, a quarter of 2022's roughly EUR 108 billion (27 ÷ 108). ACER estimates the Middle East crisis added up to EUR 18 to 33 billion to the import bill, an indicative upper bound. Rehden, Germany's largest site, was only 18% full on Oct 21. ENTSOG's October outlook has the EU at 72% on Oct 1 (about 811 TWh) against 83% a year earlier (about 940 TWh), a gap of 129 TWh.

Through the window, filling nearly stalled. AGSI+ showed 74.6% on Oct 23 and, per tracker GEF's direct read, 74.93% for gas day Oct 26, +0.33 points in three days. The regulation normally requires 90% by Nov 1, and the Commission invited states to use its flexibilities; GEF cites a relaxed 80% target, which would need (80 − 74.93) ÷ 6 = 0.84 points a day, against about 0.16 recently. The Nov 1 outcome is not in the material. The gap to the five-year average is 16.6 points per AGSI+, about 15 per GEF and about 14 per Discovery Alert; we follow AGSI+.

3.4 LNG supply and what is coming

ENTSOG says Hormuz carries about 20% of global LNG trade, that shipping remains significantly constrained, and that Qatar supplied only about 8% of EU LNG imports in 2025. Europe's exposure is indirect: ACER says the US supplies 64% of EU LNG imports, while the disruption sharpens competition with Asia. JKM rose to the high USD 31s on Oct 23 on demand from China, South Korea and India, and Japan's power-sector LNG stocks were 2.54 Mt on Oct 18, down 0.10 Mt (context).

Undated company commentary: NGI reports BP's gas trading result was "significantly higher" than the previous quarter, and an OilPrice headline says QatarEnergy extended LNG force majeure to end-2026.

Global LNG Hub's premium teasers of Oct 29 say Queensland pipeline deliveries to LNG plants hit a Q3 record of 361.9 PJ, up almost 5%. Its Nov 2 weekly update is listed, but its content is not in the material.

The IEA's 10th Global Gas Security Review and Q4 Gas Market Report is scheduled for launch on Nov 3 (upcoming, today). Its description says European storage is at its lowest in over a decade; its findings are not in the material.

4. Precious metals

After gas moved on weather and storage (see Chapter 3), the window's sharpest repricing came in bullion: metals bounced on Oct 27, then slid through the Fed hold on Oct 28 to one-year lows on Oct 30. Prices are USD per troy ounce, each labelled as a futures settle, spot quote or close.

4.1 Prices at a glance

Item Key figure Date Status Source
Gold, LBMA Gold Price PM $4,013.3 Oct 23 (pre-window) Reported WGC
Gold, COMEX Dec settle $4,074.60, $4,051.60, $4,031.40 Oct 27, 28, 29 Reported Reuters; Guardian Gold
Gold, Oct 30 close $3,875-$3,885 (sources differ) Oct 30 Reported see 4.2
Silver, spot $53.9 to $49.12 Oct 23 to 30 Reported WGC; Bullion Trading
Platinum / palladium, spot close $1,434.05 / $979.73 Oct 30 Reported Bullion Trading
Reuters poll, gold 2026 median $4,495 Oct 27 Estimate Reuters

Gold fell about 3.2% and silver about 8.9% between Oct 23 and Oct 30, as December Fed-hike odds of 75-86% and oil-driven inflation outweighed safe-haven demand.

Arithmetic: gold (4,013.3 - 3,885) / 4,013.3 = 3.2%, mixing the LBMA benchmark with a COMEX settle, so indicative; silver (53.9 - 49.12) / 53.9 = 8.9%.

4.2 Gold: Fed hold, oil and the Oct 30 break

Gold rebounded on Oct 27: spot rose 1% to $4,055.14 after a low of $3,987.14, and the Dec future settled at $4,074.60 (+0.9%) on softer oil and Middle East talks. On Oct 28 the FOMC held at 3.75%-4.00% by 10-2; Governor Lisa Cook and Cleveland Fed President Beth Hammack preferred a quarter-point hike, and the statement called activity "strong" and inflation "elevated". The future settled at $4,051.60 (-0.6%) with the 10-year yield at 5.034% in the afternoon and 5.042% after Warsh spoke (Chapter 7). CME FedWatch put a December hike at 83% on Oct 27, 86% on Oct 28 and about 75% on Oct 30. Chapter 7 covers the macro detail.

Chain from the Hormuz shock through inflation and Fed-hike odds to gold and silver.

On Oct 29 the Dec future settled at $4,031.40 (-0.5%) as US third-quarter GDP of 3.4% kept hike bets alive, per Guardian Gold summarising Kitco. On Oct 30 it opened at $4,033.60 and was at $3,986.20 by 7:04 a.m. ET after a tanker was hit near Hormuz (see Chapter 2). Reuters added Houthi attacks on Saudi Arabia and strong US inflation data; Bullion Trading's AI-written brief adds a tech sell-off. These are press attributions; the analyst view (Tai Wong) is that higher yields cap the upside.

Where sources disagree on the Oct 30 close. COMEX front-month settled at $3,885, per thetrading.tools; SD Bullion's ticker change of -$146.36 matches 4,031.40 - 3,885.04. Bullion Trading gives $3,876.73 (-3.57%), and SD Bullion and Benzinga give $3,875. We follow $3,885 as the futures settle and read $3,875-$3,877 as spot-style closes; the material has no CME or LBMA print. The one-day fall is (4,031.40 - 3,885) / 4,031.40 = 3.6%.

4.3 Silver, platinum and palladium

Silver rose 0.5% to $54.20 on Oct 27 after touching its lowest in almost a year, closed at $49.12 (-5.79%) on Oct 30 and broke the $50 mark that capped the 1980 and 2011 peaks. The gold-silver ratio rose from 74.5 (4,013.3 / 53.9, Oct 23) to 78.9 (3,876.73 / 49.12). According to SD Bullion, citing Metals Focus, London's free silver stock is near 267 million ounces, almost double its October 2025 low, and Metals Focus sees a possible 2027 surplus. Saxo's Ole Hansen (analyst view, Oct 30) named silver and platinum among October's biggest losers and said crowded positioning amplified the fall.

Platinum edged up 0.3% to $1,530.75 on Oct 27 after a fall to its lowest since late November 2025, closed Oct 29 at $1,482 bid (-3.52%) and Oct 30 at $1,434.05 (-16.2% over 30 days). From $1,534.50 on Oct 28 (intraday) that is -6.5% (100.45 / 1,534.50). Palladium dropped 2.1% to $1,027.67 on Oct 27 after slipping to its lowest since June 2025 and closed Oct 30 at $979.73 (-19.1% over 30 days); from $1,014.50 on Oct 28 that is -3.4%. Guardian Gold, relaying a secondary source, said low London lease rates showed no physical squeeze. The material has no Oct 23 platinum or palladium price.

4.4 Flows, central banks and forecasts

ETF figures disagree because sources measure different funds and periods. 24/7 Wall St, citing the Kobeissi Letter, reports a $1.8 billion October outflow from SPDR Gold Shares (GLD); Benzinga says $1.4 billion. thetrading.tools shows nine US gold ETFs losing $672 million in the provisional week of Oct 23-29, yet taking in $4.4 billion year to date. ETF Action (week undated) shows GLD at -$2,297 million while GLDM took in $288 million, a rotation to cheaper funds. We treat GLD's October outflow as a $1.4-1.8 billion range; WGC's monthly ETF file is not in the material.

Central-bank buying was 170 tonnes through end-August (WGC via VanEck, context). WGC's latest Gold Demand Trends in the material is Q2 2026, so Q3 is a gap. Reuters reported China's net gold imports via Hong Kong in September up 28% from August.

The Reuters poll of 30 analysts (Oct 27, estimate) cut the 2026 gold median to $4,495 from $4,509 (-$14, -0.3%), a second straight quarterly cut on high yields and the dollar, and raised 2027 to $4,650 from $4,610 (+0.9%). It ran for three weeks, so it predates the Oct 30 close; the median is 15.7% above $3,885 ((4,495 - 3,885) / 3,885). Silver averages $70.30 in 2026 and $66.75 in 2027 in the poll, with weak solar demand cited.

Upcoming: US midterms on Nov 3 and US October payrolls, expected at over 50,000 jobs after 29,000 in September (Benzinga, estimate; date not stated). This describes the market and is not investment advice.

5. Industrial metals

Chapter 4 covered precious metals around the Oct 28 Fed hold; industrial metals traded on the same macro tape, but their story in the window was physical tightness in China against a softer screen price.

5.1 Prices at a glance

Item Key figure Date Status Source
LME copper 3M, USD/t 14,140 vs Oct 23 close 14,322.50: −1.27% Oct 30 Reported (intraday vs close) Reuters via Mining.com; LME Insight
SHFE spot copper premium, yuan/t 1,140 (850 on Oct 23) Oct 29 Reported SMM
Shanghai + Jiangsu copper stocks, t 57,900, −14,400 w/w Oct 29 Reported SMM
LME aluminium 3M, USD/t 3,064; +0.67% vs Oct 23 Oct 30 Reported (intraday vs close) Reuters via Mining.com; LME Insight
LME zinc / nickel / tin 3M, USD/t 3,831 / 15,250 / 48,505 Oct 30 Reported (intraday) Reuters via Mining.com
Mysteel 61% iron ore fines, USD/dmt CFR Qingdao 91.05, +0.77% Nov 2 Reported Mysteel

5.2 Copper: tighter in China, softer on the screen

LME three-month copper closed Oct 23 at $14,322.50 (context). It rose 1.1% to $14,487.50 intraday on Oct 27 (Reuters). For Oct 28 the sources split: cash settlement of $14,675.50 (Westmetall series, via OJ Metal Recycling) against a cash bid/ask of $14,733/14,735 attributed to LME official prices. I follow the first because it names a published series; the $57.50 gap is unexplained. SMM puts the Oct 29 close at $14,352, down 0.96% on long liquidation. On Oct 30 the price was $14,140 at 17:20 GMT, down 1.5%, with October heading for a 1.8% fall that would end a three-month winning streak. Reuters blames AI-spending worries, higher oil and a tech slump. The window change mixes a close with an intraday print: 14,140 − 14,322.50 = −182.50, or −1.27%.

The screen price slipped 1.8% in October while Chinese physical metal got scarcer: the SHFE spot premium rose from 850 to 1,140 yuan/t in a week (+290, +34%).

LME screen market and China physical market side by side, with the US tariff and warehouse link.

SMM (industry data provider) cites typhoon-delayed imports and smelter maintenance. Its Oct 29 figures:

  • Shanghai stocks 42,700 t (−8,400 w/w) and Jiangsu 15,200 t (−6,000): combined −14,400 t.
  • National mainstream stocks fell 24,900 t to about 80,000 t, against about 180,000 t a year earlier. SMM calls the gap about 110,000 t, but its rounded figures imply 100,000 t.
  • Shanghai import loss was about 1,243 yuan/t, wider by 832 on the week; the Yangshan premium passed $200/t, a record in SMM's series.
  • LME cash-to-3M backwardation widened to $204.66/t (SMM) from $149.50 on Oct 23 (LME Insight): +$55.16, across two sources.

High premiums are pushing some buyers aside. Exchange stocks tell another story: LME stocks were 273,750 t on Oct 23, up 48,325 t (+21.4%) on the week (context), and 274,000 t on Oct 30 (SMM via minelistings). Tacto, citing Reuters of Oct 22, puts 169,475 t in US warehouses, 169,475 ÷ 273,750 = 62% (context), and links the inflow to a proposed US refined-copper tariff of 15% from 2027 and 30% from 2028, still undecided. Supply news. Teck's Oct 28 release reported Q3 copper output of 115,700 t (+11%) at an average US$6.40/lb, about $14,110/t. Chile's September output fell 15% y/y, and Rio Tinto began restarting Oyu Tolgoi after a seismic event (Reuters).

5.3 Aluminium, zinc, nickel and tin

The LME weekly review for Oct 26–30 is not in the material, so this section rebuilds the week from Reuters prints and SMM stocks.

Aluminium. The Oct 23 close was $3,043.50 (context). Three-month aluminium was $3,025 on Oct 26, $3,067 on Oct 29 and $3,064 on Oct 30: +0.67% (20.50 ÷ 3,043.50), close versus intraday. SMM data put LME stocks at 231,200 t on Oct 30, against 235,800 t on Oct 23.

Zinc led the complex. It reached $3,795 on Oct 26 in official open outcry (+1.4%) as stocks fell and power prices rose, $3,882 on Oct 29, a one-month high, then lost 1.3% to $3,831 on Oct 30. The implied Oct 23 level, 3,795 ÷ 1.014 ≈ 3,743, gives about +2.4% over the window (estimate). LME stocks were 165,700 t on Oct 27 and 161,275 t on Oct 30; cash traded about $81 over three-month on Oct 26.

Nickel and tin fell. Nickel went from $15,710 (Oct 26) to $15,490 (Oct 29) to $15,250 (Oct 30); against an implied Oct 23 level near 15,853 that is about −3.8% (estimate). Tin touched $48,100, its lowest in over six months,. Indonesian nickel supply is covered in Chapter 6.

5.4 Iron ore and Chinese steel: weak demand, ample supply

Seaborne ore stayed near $90. Kallanish's 62% Fe index was $90.3/t CFR Qingdao on Oct 27, and Singapore futures touched $89.25 that day. Mysteel's 61% fines index was $91.05/dmt on Nov 2, up $0.70. The two readings are $0.75 apart but use different indices, so no window change is computed. Dalian's most-traded contract rose 0.59% to 679 yuan on Nov 2 after falling 4.3% in October.

Demand evidence is soft. Hot-metal output at surveyed mills was about 2.32 Mt a day on Oct 29, down 0.2% w/w. Mysteel's HRC output at 37 mills was 2.88 Mt in Oct 22–28, 11% below last year. GMK Center cites weak demand, thin margins, large port stocks and Simandou supply, and says Rio Tinto's reported CMRG deal (November 2026 to May 2028) removes a disruption premium.

Earlier data frame this (context): January–September imports were 954.97 Mt (+4.1%) while crude steel fell 2.9% to 724.77 Mt, and port stocks were 152.23 Mt in the week to Oct 23, 14% above last year (via a LinkedIn article). Fortescue's Oct 22 report showed 46.8 Mt shipped against 42.9 Mt sold, a 3.9 Mt gap, and warned of production effects if CMRG talks remain unresolved at end-December (upcoming).

6. Battery metals

Chapter 5 covered the industrial metals, including where LME nickel trades; this chapter turns to battery-metal inputs, where lithium, cobalt and nickel were pushed down by supply rather than by a lack of metal. Dates are judged against Nov 3, 2026; the window is Oct 24 to Nov 2.

6.1 Battery metals at a glance

Item Key figure Date Status Source
SMM battery-grade lithium carbonate, average spot 96,100 yuan/t, -900 (-0.9%) vs Oct 23 Oct 29 reported SMM, data provider
GFEX LC2701 futures, close 88,360 yuan/t, -8.4% on the day Oct 29 reported SMM
Lithium carbonate, CJK spot $12.80-15.00/kg Oct 27 reported Fastmarkets via MineralPrices
Indonesia nickel benchmark (HMA) $15,847.67/t, -2.91% second half of Oct (release date not stated) in effect ESDM via SMM
Indonesian nickel cuts size, timing unconfirmed Oct 20-24 press report Reuters, Bloomberg via Oregon Group
Cobalt hydroxide, cif China $13.00-14.00/lb Oct 27 reported Fastmarkets via MineralPrices
Glencore own-sourced cobalt, Jan-Sep 13,700 t, -52% Oct 29 reported Glencore via Oregon Group

Battery metals fell on supply, not shortage: Chinese lithium output kept rising, Glencore's cobalt is held back by Congo's quotas, and nickel's only support was Indonesian cut talk that no producer had confirmed by Nov 2.

LME three-month nickel was $15,250 on Oct 30 (intraday, Reuters; see Chapter 5). The material holds no battery-metal price dated Oct 31 to Nov 2.

6.2 Lithium: a rebound that failed at 100,000 yuan

SMM's average spot price rose from 97,000 yuan/t on Oct 23 to 98,300 on Oct 26, 99,350 on Oct 27 and 100,050 on Oct 28, then fell 3,950 to 96,100 on Oct 29, erasing the week's gains. The window move is -900 yuan, or -0.93% (900 / 97,000).

Futures were far more volatile. LC2701 closed at 98,500 on Oct 27 after touching 99,880. On Oct 28 it hit 101,520, closed at 93,300 and settled at 96,460, a range of about 9,200 yuan, with volume up 17.6% to 398,200 lots. On Oct 29 it closed at 88,360, below the 90,000 support level.

The "8.4%" is a one-day move: (88,360 - 96,460) / 96,460 = -8.4% against the Oct 28 settlement. SMM puts the weekly fall at -6.18%. Spot (an SMM average) and futures (a close) are not like-for-like.

SMM's drivers are industry-data-provider views, not official statements. Chinese output kept rising on spodumene arrivals and new lines, while cathode and cell makers cut orders and bought only for rigid needs. Total inventory fell just 1,894 t to 128,385 t (-1.5%) as smelter stocks built, and SMM expects a next-week range of 80,000-105,000 yuan/t (estimate). Buyers clustered at 90,000-95,000 yuan on Oct 27.

Fastmarkets assessed CJK carbonate at $12.80-15.00/kg on Oct 27 against a 2026 high of $24.50-25.80 on May 11; midpoints of 13.90 and 25.15 imply -44.7%.

Eramet's Q3 release (company, Oct 29) shows lithium turnover of EUR 70m against EUR 7m and carbonate output of 4,260 t LCE against 2,080 t (+105%). It adopts "a more conservative view for lithium as recently observed" for Q4. The material holds no lithium mine-restart report. One upcoming supply item: a public notice on Gotion's Shuinan lithium mine environmental filing runs Nov 2 to 13.

6.3 Nickel and cobalt: cut talk and quotas

Nickel. The cut story is mostly context. On Oct 22 Nickel Industries said "there will be coordinated cuts across all of the operations" at Morowali, without a percentage, and Bloomberg reported that an Oct 20 meeting agreed to cut MHP by 50% and NPI by about 20%. Huayou Cobalt said "the meeting isn't true". Reuters sources said size and duration were undecided; this is a press report, and a Fubao analyst saw real MHP cuts nearer 15-25%. Fastmarkets noted on Oct 28 that companies had not confirmed cuts. Context from Oct 23, per Yieh Corp: INSG moved its 2026 primary nickel balance from a 32,000 t deficit to a 19,000 t surplus.

In the window, data point to weakness. Indonesia's second-half-October HMA was $15,847.67/t, down $475 from $16,322.67, or -2.91% (475 / 16,322.67). SMM's Oct 30 assessment put Indonesian Ni 1.2% limonite at $24.5/wmt and Philippine Ni 0.9% FOB at $21.5/wmt, down $1; some Morowali RKEF lines have run at 30-40% of normal since Sept 22, though not park-wide. Eramet said its PT WBN mine restarted in September after four months of care and maintenance and raised its 2026 external nickel-ore sales target to 23-26 Mwmt from 9; Q3 sales were 1.6 Mwmt against 9.3, or -83%.

Cobalt. Fastmarkets' hydroxide assessment fell to $13.00-14.00/lb on Oct 27 from $14.25-15.00 the day before; against the Apr 27 peak of $26.00-26.25, midpoints of 13.50 and 26.125 give -48.3%. Congo's weekly reference price was $38,596/t in the week to Oct 24, down 30.6% from $55,608 in early September.

Glencore's Q3 production report (Oct 29) showed own-sourced cobalt of 13,700 t in January-September against 28,500 t, a 52% fall, and 3,500 t in Q3, down 20% on Q2. Bankable's 56% fall to 11,600 t (from 26,500) covers only its Congolese mines, a different base. Glencore blames the quota regime and keeps cobalt in solution, which is not counted as production. The quota is 96,600 t a year for 2026-27, in effect since Oct 16, 2025, per USGS via Oregon Group. Market sources told Benchmark they expect a 25% cut next year; ARECOMS has announced none, so it is a press report. CMOC produced 99,694 t of cobalt in January-September but sold 12,661 t (12.7%, 12,661 / 99,694), so unsold metal is piling up behind the quotas. Demand is the stated primary problem: weak consumer electronics and large Chinese stocks of sulphate and recycled material.

7. Macro drivers and demand

Chapters 2–6 followed each commodity; this chapter covers the macro and demand forces behind those moves.

Core claim: the window turned on rates, not growth. The Fed held at 3.75–4.00% with two votes to hike and US GDP beat at 3.4%, yet yields and the dollar fell on a tech-led rotation into Treasuries, while China's official PMI slipped to 49.3 and the private one held at 52.0.

Item Key figure Date Status Source
FOMC target range 3.75–4.00%, vote 10–2 Oct 28 decision, in effect Federal Reserve
US Q3 GDP (advance) 3.4% vs 2.2% in Q2 Oct 29 reported Fox Business
US Sept PCE 3.6% y/y; core 3.1% Oct 29 reported Fox Business
10-year Treasury 5.042% intraday; 4.988% Oct 28; Oct 29 reported (recaps) Reuters; Investrade
NBS manufacturing PMI 49.3 (Sept 50.1) Oct 31 reported AFP
RatingDog manufacturing PMI 52.0 (Sept 52.1) Nov 2 reported Trading Economics
BCOM TR, October "nearly unchanged" Oct 30 analyst view Saxo via Kitco
BCOM 2027 weights Energy 29.37%, Precious Metals 19.49% Oct 29 announced Bloomberg

7.1 The Fed hold, US data, the dollar and yields

On Oct 28 the FOMC kept the target range at 3-3/4 to 4 percent by 10–2; Lisa Cook and Beth Hammack preferred a quarter-point hike, and interest on reserve balances stayed at 3.90% from Oct 29. The statement says inflation "remains elevated"; Reuters adds that the economy was upgraded to "strong" from "solid" and that this was a hold after a September hike. Chair Warsh said energy prices "have moved higher again" and that the Fed must stop relative price changes broadening out.

The hold was expected: the World Gold Council put the odds of a hike at that meeting at under 10% on Oct 26. December is the live question. CME FedWatch, quoted by Reuters, showed an 83% chance of a December hike on Oct 27, 86% after the decision and about 75% on Oct 30, so roughly 11 points came off in two days (86 − 75).

Oct 29 data were firm. Q3 GDP grew 3.4% annualised, +1.2 points on Q2's 2.2% and 0.2 point above the 3.2% LSEG consensus (Investrade's recap says 3.1%). September PCE rose 0.5% m/m and 3.6% y/y (August 3.4%, +0.2 point), core 0.3% m/m and 3.1% y/y (August 3.0%), all in line with LSEG. Recaps calling inflation "better" refer to the Q3 PCE price index at 2.1% annualised (Q2: 5.0%), a quarterly rate, not the 3.6% annual one.

Yields and the dollar moved the other way. The 10-year was 5.042% intraday on Oct 28, 4.988% on Oct 29 (−5.6 bp) and about 4.93% on Oct 30, roughly 11–12 bp lower from Oct 28 (5.04 − 4.93). According to a broker blog, the dollar index fell 0.12%, 0.15% and 0.15% on Oct 28–30, about −0.4% in total, though October as a whole was +0.4% (101.45 to 101.88). The euro hit a 17-month low near $1.11 on Oct 29 after the ECB held. The explanation is an analyst view: tech earnings (Alphabet −12%, Nasdaq −1.38%) sent money into Treasuries, and OCBC's Sim Moh Siong tied the dollar's slip to "lower Treasury yields". Gold fell regardless (see Chapter 4). The material has no Oct 23 yield or dollar level, so a full-window change cannot be computed.

7.2 China's PMIs: two surveys, two stories

The NBS/CFLP release of Oct 31 put manufacturing at 49.3 (September 50.1, −0.8), 0.6 under the 49.9 Bloomberg forecast (49.9 − 49.3); non-manufacturing was 49.7 (50.2) and composite output 49.7 (50.7). New orders fell to 49.4 (−1.1) and production to 49.8 (−1.9), which the NBS's Huo Lihui partly tied to demand pulled forward before the National Day holiday. High-tech (51.3) and equipment (50.6) stayed above 50; consumer goods (48.8) and high-energy-consuming industries (47.3) did not, and construction fell 2.3 points to 48.0. Input prices cooled to 56.8 (−4.0) on lower nonferrous metals prices, while oil-, coal- and chemical-linked indices stayed above 60 as crude rose, according to Fistotex quoting the NBS.

The RatingDog private-sector manufacturing PMI, released Nov 2, was 52.0 (September 52.1, −0.1), an 11th month above 50, with output at a six-month high and new orders up for a 17th month. Export orders rose for a fourth month but at a three-month-low pace; input-cost inflation eased, selling prices fell and sentiment dropped to a nine-month low. Trading Economics says 52.0 beat a 51.6 forecast, Investing.com says it matched expectations; neither calls it a miss. Investing.com attributes the gap to coverage (the official survey has more large and state firms), but the NBS shows large firms at 50.2 and small ones at 47.5, so coverage does not fully explain it. For commodities, the weak segments are the ones feeding steel, coal and base metals, consistent with Saxo's mention of "softer Chinese demand" and a small October decline in industrial metals (see Chapter 5).

7.3 The Bloomberg Commodity Index: a flat month, a sharp rotation, new weights

Saxo Bank's Ole Hansen wrote on Oct 30 that the Bloomberg Commodity Total Return Index was "heading for a nearly unchanged October", a forecast of the month-end, not a final figure (analyst view, via Kitco). Beneath it, energy and softs gained, grains and precious metals lost and industrial metals slipped; he cited bond yields, speculative long liquidation and AI-investment worries for silver and platinum. Year to date he put energy up almost 100% and precious metals down about 11% (after about +80% in 2025). The WGC, citing Bloomberg, had the index at 143.7, −0.51% on the week and +31.0% year to date on Oct 23, which is pre-window context; no Oct 30 level is in the material.

Bloomberg announced the 2027 target weights on Oct 29, effective in the January 2027 roll (upcoming):

Group (2027 target) Weight Note Source
Energy 29.37% third annual fall; still largest Bloomberg
Grains 20.61% record low Bloomberg
Precious Metals 19.49% gold 14.93%, silver 4.56% Bloomberg
Industrial Metals 15.75% little changed Bloomberg
Softs 8.84% from 9.17% Bloomberg
Livestock 5.94% from 5.64% Bloomberg

The groups sum to 100.00%. Brent rises to a record 8.59% and WTI falls to a record-low 6.41%, together 15.00%, so Brent is 57% of crude (8.59 / 15.00). Gold plus silver equals the whole 19.49% group (14.93 + 4.56). My reading: they follow trailing data, so the index tilts toward precious metals just after their 2026 slump.

8. Supply and demand risks and what to watch

Chapters 2-7 followed each commodity and the macro backdrop; this chapter pulls out the risks that remain open on Nov 3 and the dates that will settle them. It adds no new facts, and what follows describes exposure, not investment advice.

8.1 Risks by commodity

Oil. The supply risk is physical and political. Hormuz oil flow was 9.34 mb/d, 54% of the 17.15 mb/d prewar level, and a tanker was hit by explosive devices there on Oct 30. Saxo (analyst view) noted that some investors expect US attacks to resume after the midterms on Nov 3. The December OPEC+ decision from the Nov 1 meeting is not in the material, and the Dec-Jan Brent gap of $4.21 shows prompt barrels still carry a premium. On the demand side, EIA's US crude stocks fell 1.892 mn bbl to 410.625 mn bbl in the week to Oct 23.

Gas. Two opposite risks sit side by side. In the US, speculators held a net short of 241,272 contracts, the largest since Feb 11, 2020 (as of Oct 20), against a market already at its lowest since Apr 28. In Europe, storage was 74.93% on Oct 26, and 80% would need 0.84 points a day against about 0.16 recently. Hormuz carries about 20% of global LNG trade.

Gold and silver. The demand risk is rates. A December hike was priced at about 75% on Oct 30, and the 2026 Reuters poll median for gold is $4,495 (estimate, Oct 27). GLD's October outflow is $1.4-1.8 billion depending on the source, and WGC's Q3 demand data are not in the material.

Copper and industrial metals. China's physical market is tight (SHFE premium 1,140 yuan/t, Shanghai plus Jiangsu stocks 57,900 t) while LME stocks were about 274,000 t on Oct 30 and about 62% of them sat in US warehouses around Oct 22-23 (context). A proposed US refined-copper tariff of 15% from 2027 and 30% from 2028 is undecided. Chinese steel demand is soft: hot-metal output was about 2.32 Mt a day, and Fortescue warned of production effects if CMRG talks stay unresolved at the end of December.

Lithium, nickel and cobalt. SMM expects a next-week lithium range of 80,000-105,000 yuan/t (estimate), after a 9,200 yuan intraday range on Oct 28. Indonesian nickel cuts remain a press report, and Congo's cobalt quota of 96,600 t a year may be cut by 25% next year, which ARECOMS has not announced.

8.2 What changed and what it means by reader

The window's risks are asymmetric across the supply chain: oil and European gas carry supply risk, bullion carries rate risk, and battery metals carry oversupply risk, so the same Hormuz shock hurts consumers of energy but does not lift every commodity.

Reader What changed Implication Evidence
Oil producers and shippers Brent Dec settled $117.64 on Oct 30; tanker freight $30-$40/bbl; flow 54% of prewar Revenue and freight costs both rise; the premium rests on risk, freight and thin product stocks more than lost barrels (analyst view) —
Oil consumers and refiners Brent +13.6% in October; Dec-Jan gap $4.21; UBS end-2026 Brent estimate $110 Prompt cargoes cost more than later ones; forecasts are estimates, not prices —
European gas buyers and utilities EU storage 74.93% on Oct 26; filling slowed to about 0.16 points a day The US supplies 64% of EU LNG imports; the 80% level needs a much faster pace —
US gas producers Henry Hub Nov settled $2.602 on Oct 26, lowest since Apr 28 Weather and heavy output set the price (consultant view); the crowded short adds volatility —
Gold and silver investors Gold $3,885 and silver $49.12 on Oct 30; Fed held 10-2 with two hike votes Prices follow yields and hike odds more than the war; ETF flows were negative —
Copper and metal buyers in China SHFE premium 850 to 1,140 yuan/t; stocks down 14,400 t in a week Physical tightness at home despite a softer LME price —
Battery makers and lithium producers SMM lithium 96,100 yuan/t; LC2701 closed 88,360 Output is rising while buyers purchase only for need, so price swings are wide —
Cobalt and nickel producers Glencore cobalt -52% to 13,700 t; nickel HMA -2.91% Quotas cap volume while demand is weak; cuts are talk until confirmed —
Index investors BCOM 2027 weights: Energy 29.37%, Precious Metals 19.49%; October nearly unchanged (analyst view) Weights follow trailing data, so exposure tilts toward precious metals after their 2026 slump —

8.3 Key dates

"State on Nov 3, 2026" is judged against today. Dates marked "not stated" are not given in Chapters 2-7.

Date Event State on Nov 3, 2026 Source
Oct 16, 2025 Congo cobalt quota of 96,600 t a year (2026-27) starts In effect USGS via Oregon Group
Oct 28 FOMC holds 3.75-4.00%, vote 10-2 In effect (decision) Federal Reserve
Oct 29 Bloomberg announces 2027 BCOM weights Announced; effective Jan 2027 Bloomberg
Oct 31 NBS manufacturing PMI 49.3 Reported China-Global South Project
Nov 1 OPEC+ seven-country meeting Meeting held; December decision not in material OPEC
Nov 2 RatingDog manufacturing PMI 52.0 Reported Trading Economics
Nov 2-13 Public notice on Gotion's Shuinan lithium mine filing In effect (running) SMM
Nov 3 US midterm elections Upcoming (today) Reuters
Nov 3 IEA Global Gas Security Review and Q4 Gas Market Report Upcoming (today) IEA
Nov 4 EIA weekly crude inventory report Upcoming EIA
Not stated US October payrolls (expected above 50,000 jobs, estimate) Upcoming Benzinga
Not stated (December) Next FOMC meeting; December hike odds about 75% on Oct 30 Upcoming Reuters
End-December Fortescue warns of production effects if CMRG talks remain unresolved Upcoming Fortescue via LinkedIn
Jan 2027 BCOM 2027 target weights take effect in the roll Upcoming Bloomberg
2027 (proposal) US refined-copper tariff of 15%, rising to 30% from 2028 Proposed, no decision Tacto citing Reuters

9. References

This document draws on the following 88 sources, listed in the order they are first cited.

  1. Brent ends October up 13.6% as Iran war risks unsettle markets — nationthailand.com
  2. Oil Prices Fall After Weekend Rally, Diplomacy and Security Tensions Loom | CORNERSTONE FUTURES LLC posted on the topic | LinkedIn — linkedin.com
  3. Oil prices set for sharp monthly rise on Hormuz strikes and US threat to hit Iran | The National — thenationalnews.com
  4. Oil set for fourth monthly gain as Hormuz tanker attack highlights supply risks | Reuters — reuters.com
  5. Hormuz at 54% of Prewar Flows Inflates Brent, Capping WTI Downside - Article | Crux Investor — cruxinvestor.com
  6. Organization of the Petroleum Exporting Countries — opec.org
  7. Week in Review - Middle East Disruptions Push Oil Forecasts Higher While Demand Weakens - Mansfield Energy — mansfield.energy
  8. UBS raises Brent outlook, sees oil at $110/bbl by end-2026 | Reuters — reuters.com
  9. Natural Gas Prices Fall 5.6% to 2.64/MMBtu | Premier Energy Management LLC posted on the topic | LinkedIn — linkedin.com
  10. Wall Street Is Betting Big Against Natural Gas as a Mild Winter Looms — finance.yahoo.com
  11. Natural gas prices weekly update – JKM, TTF and Henry Hub (26 October 2026) | Global LNG Hub — globallnghub.com
  12. EU Gas Storage Trajectory — Fill Curve vs 5-Year Norm — global-energy-flow.com
  13. Heat Pump Monitor 2026: Webinar (afternoon session) - Event - IEA — iea.org
  14. Weekly Markets Monitor — gold.org
  15. Gold Price Today and Since 1960, With Every 20% Decline | thetrading.tools — thetrading.tools
  16. Gold and silver slid to fresh lows (Oct 30, 2026) — bulliontradingllc.com
  17. Gold Price Drops Below Key Support as GLD ETF Outflows Jump as NFP Loom - SPDR Gold Shares (ARCA:GLD),… — benzinga.com
  18. Instant View: FOMC holds rates steady, markets rise modestly | Reuters — reuters.com
  19. Gold slips on higher oil; markets assess Warsh comments after Fed holds rates steady | Reuters — reuters.com
  20. Gold slips as higher oil, US inflation data bolster Fed hike bets | Reuters — reuters.com
  21. POLL Strong dollar, high yields drag on gold outlook, but central-bank demand lends support | Reuters — reuters.com
  22. Copper price set for first monthly loss since June as AI spending worries weigh - MINING.COM — mining.com
  23. The LME Weekly Review: 19-23 October 2026 — lmeinsight.com
  24. US economic resilience strengthens rate hike expectations, copper prices consolidate under pressure SMM Copper Morning Meeting Summary - Shanghai Metals Market (SMM) — news.metal.com
  25. Tax-inclusive supply "cleared within 1-2 days"; invoices and invoice tax rates choke off volume growth SMM Copper Scrap Weekly Review - Shanghai Metals Market (SMM) — news.metal.com
  26. Inventory destocking continues, coupled with tight supply, driving Shanghai spot copper premiums gradually higher SMM SHFE Copper Spot Weekly Review - Shanghai Metals Market (SMM) — news.metal.com
  27. SMM Analysis Lithium carbonate prices plunge this week, destocking slows down - Shanghai Metals Market (SMM) — news.metal.com
  28. Glencore's cobalt output falls 52% in nine months under Congo quotas - The Oregon Group — theoregongroup.com
  29. Nickel producers weigh 50% Indonesian cuts as prices hit 10-month low - The Oregon Group — theoregongroup.com
  30. Fed’s preferred inflation gauge rose in September as third-quarter GDP beats expectations — foxbusiness.com
  31. Dollar Index (DXY) Slips 3 Sessions as Yields Drop After Fed Hold — vantagemarkets.com
  32. China's Factory Activity Returns to Contraction in October - The China-Global South Project — chinaglobalsouth.com
  33. China Manufacturing PMI Beats Estimates — tradingeconomics.com
  34. Energy surges, precious metals tumble as 2026 rotation strengthens diversification case – Saxo Bank’s Hansen | Kitco News — kitco.com
  35. Bloomberg Commodity Index 2027 Target Weights Announced | Press | Bloomberg LP — bloomberg.com
  36. Latest Analysis about China Steel & Commodities Market | Mysteel — mysteel.net
  37. Weekly Petroleum Status Report - U.S. Energy Information Administration (EIA) — eia.gov
  38. Strait of Hormuz Ship Diversions Today Oct 2026 — kingdomexploration.com
  39. Weekly Natural Gas Storage Report — ir.eia.gov
  40. Weekly Working Gas in Underground Storage — eia.gov
  41. Record Tanker Rates Cripple U.S. Crude Oil Flows to Asia | OilPrice.com — oilprice.com
  42. Glencore cobalt output sinks 52% under DRC quotas - MINING.COM — mining.com
  43. European gas storage at record low, Dutch TTF gas price surges | Discovery Alert posted on the topic | LinkedIn — linkedin.com
  44. European gas markets - Summer 2026 - acer.europa.eu — acer.europa.eu
  45. ENTSOG WINTER SUPPLY OUTLOOK 2026/2027 — entsog.eu
  46. Low European Storage Levels Signal Potential LNG Volatility, BP Says — naturalgasintel.com
  47. Queensland LNG exports hit a Q3 record as domestic gas demand retreats | Global LNG Hub — globallnghub.com
  48. LNG projects | Global LNG Hub — globallnghub.com
  49. Global Gas Security Review and Q4 Gas Market Report - Event - IEA — iea.org
  50. Gold gains on softer oil prices ahead of Fed meeting | Reuters — reuters.com
  51. Overnight Summary - Precious Metals Prices 30/10/2026 — guardian-gold.com.au
  52. Fed rate decision live: FOMC holds rates steady after September hike | Reuters — reuters.com
  53. Gold price today, Friday, October 30, 2026: Gold slips below $4,000 as Mid-East concerns mount — finance.yahoo.com
  54. Gold & Silver Return to 2025 Lows After Record Highs — sdbullion.com
  55. GLD Suffers $1.8 Billion October Outflow, Its Worst Since June | 24/7 Wall St. — 247wallst.com
  56. Gold ETF Flows: Money Moving Into and Out of GLD, IAU and US Gold ETFs | thetrading.tools — thetrading.tools
  57. Oil Rallies While Gold ETFs See Heavy Outflows - ETF Action — etfaction.com
  58. Gold ETF: Stock, Holdings and Flows | World Gold Council — gold.org
  59. A second chance to invest in gold — vaneck.com.au
  60. Gold Demand Trends | World Gold Council — gold.org
  61. Copper Prices in 2026: Will Mine Shortages Sustain the AI-Driven Rally? • Carbon Credits — carboncredits.com
  62. Copper Prices 2016–2026: Who Uses It and Why Prices Are Rising — ojmetalrecycling.co.uk
  63. Supply deficit continues to intensify, Yangshan copper premiums hit a historic high SMM Yangshan Copper Weekly Review - Shanghai Metals Market (SMM) — news.metal.com
  64. Copper Retreats to $14,310 as China Stocks Drop 27% — minelistings.com
  65. Copper Price Today: Price, Trends & Forecast 2026 | Tacto — tacto.ai
  66. TECK Q3 2026 News Release — teck.com
  67. Zinc price hits two-week high as tight stocks spur bullish sentiment - Mining.com.au — mining.com.au
  68. LME Zinc Stocks (Oct 27, 2026): 165.7K mt, Up 36.2% in 30 Days — thevaultreport.com
  69. Iron ore prices remained under pressure in the second half of October — gmk.center
  70. Iron-Ore Prices Rise After Sharp Declines as Chinese Demand Holds Up - News and Statistics - IndexBox — indexbox.io
  71. China Is Importing More Iron Ore While Producing Less Steel. Is Global Pricing Power Shifting? — linkedin.com
  72. Fortescue's Iron Ore Sales Trail Shipments by 3.9 Million Tonnes — What Happens Next? — linkedin.com
  73. SMM Lithium Carbonate Daily Review On October 28, spot lithium carbonate prices rose by 700 yuan/mt, while futures retreated after a rapid rise, falling on increased volume and open interest. - Shanghai Metals Market (SMM) — news.metal.com
  74. Lithium, cobalt markets cautious on China’s demand – MineralPrices.com — mineralprices.com
  75. SMM Nickel Ore Market Weekly Review Indonesia's Benchmark Price Cut and Weak Demand Put Regional Nickel Ore Prices Under Pressure - Shanghai Metals Market (SMM) — news.metal.com
  76. SMM Lithium Carbonate Daily Review On October 26, spot lithium carbonate stopped falling and rebounded, ending its previous consecutive decline. - Shanghai Metals Market (SMM) — news.metal.com
  77. SMM Lithium Carbonate Daily Review Lithium Carbonate Futures and Spot Prices Rebound in Tandem on October 27 - Shanghai Metals Market (SMM) — news.metal.com
  78. solid operational momentum in Q3 and progress on the funding plan — eramet.com
  79. Eramet: solid operational momentum in Q3 and progress on — globenewswire.com
  80. LME nickel prices rebound on Indonesian production cut rumors while surplus outlook remains-Yieh Corp Steel News — yieh.com
  81. Glencore's Copper Output Jumps 37% in DR Congo, While Cobalt Production Falls 56% - BANKABLE — bankable.africa
  82. Federal Reserve issues FOMC statement — federalreserve.gov
  83. Market Review: October 29, 2026 - Investrade — investrade.com
  84. Federal Reserve Board - Federal Reserve issues FOMC statement — federalreserve.gov
  85. Transcript of Chairman Warsh's Press Conference, October ... — federalreserve.gov
  86. U.S. GDP Accelerates to 3.4% in Q3 2026 as Consumer Spending & Inflation Pressures Persist — linkedin.com
  87. China's October 2026 PMI: all three headline indices slip below 50 | Fistotex — fistotex.com
  88. China factory output grows at fastest pace in 6 months: RatingDog PMI — au.finance.yahoo.com

互动网页 · 可在框内滚动 新窗口打开 ↗

Generated with Divrite — 本作品由 AI 根据上面的问题生成,可能有错漏,引用前请核对来源。

相关能力

问一个你自己的问题

Divrite 帮你深入调研,核心数字逐条对照来源校验,再做成 PPT、报告或网页。